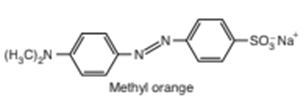
19-C. The protein bovine serum albumin can bind several molecules of the dye methyl orange. To measure the binding constant K for one dye molecule, solutions were prepared with a fixed concentration \(\left( {{X_0}} \right)\) of dye and a larger, variable concentration of protein (P). The equilibrium is Reaction 19-18, with X 5 methyl
orange.

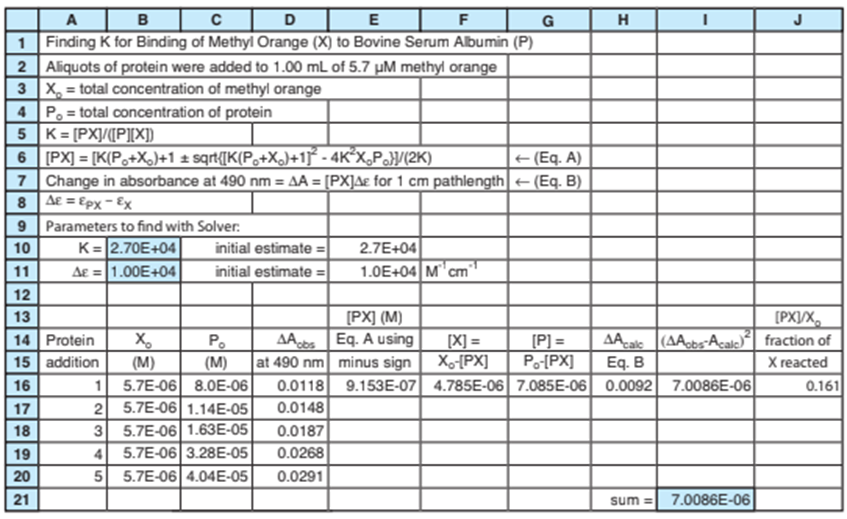
Experimental data are shown in cells A16-D20 in the spreadsheet on the next page. The authors report the increase in absorbance \((\Delta A)\) at 490 nm as P is added to X. X and PX absorb visible light, but P does not. Equilibrium expression 19-20 applies and (PX) is given by Equation 19-21. Before P is added, the absorbance is \({\varepsilon _X}{X_{0 - }}\). The increase in absorbance when P is added is

The spreadsheet uses Solver to vary K and \(\Delta E\) in cells B10:B11 to minimize the sum of squares of differences between observed and calculated \(\Delta A\) in solutions with different amounts of P. Cell E16 computes (PX) from Equation 19-21, which is Equation A on line 6 of the spreadsheet. Cells F16 and G16 find (X) and (P) from mass balances. Cell H16 computes \(\Delta {A_{calc}} = \Delta E(PX)\)which is Equation B on line 7.
To estimate a value of K in cell B10, suppose that 50% of X has reacted in row 20 of the spreadsheet. The total concentration of X is\({X_0} = 5.7\mu M\). If half is reacted, then \((X) = (PX) = 2.85\mu M\) and\((P) = {P_0} - (PX) = 40.4 - 2.85 = 37.55\mu M\). The binding
constant is \(K = (PX)/(P)(X)) = (2.85\mu M)/(37.55\mu M)(2.85\mu M)) = \)\(2.7 \times 1{0^4}\) which we enter as our guess for K in cell B10. We estimate \(\Delta \varepsilon \)in cell B11 by supposing that 50% of X has reacted in row 20. In Equation B on line 7, \(\Delta A = \Delta \varepsilon (PX)\).The measured
value of \((\Delta A)\)in row 20 is 0.0291 and we just estimated that \((PX) = \)\(2.85\mu M\). Therefore, our guess for \(\Delta \varepsilon \)in cell B11 is \(\Delta \varepsilon = \Delta A/\)\((PX) = (0.0291)/(2.85\mu M) = 1.0 \times 1{0^4}\)
Your assignment is to write formulas in columns E through J of the spreadsheet to reproduce what is shown and to find values in cells E17:J20. Then use Solver to find K and \(\Delta \varepsilon \)in cells B10:B11 to minimize \(\Sigma {\left( {{A_{oths\;}} - {A_{calc\;}}} \right)^2}\)in cell I21.


