Use two market diagrams to explain how an increase in state subsidies to public colleges might affect tuition and enrollments in both public and private colleges.

Short Answer

Expert verified

The two market diagrams are plotted below:

The subsidies provided in public colleges act as a supply shifter. The result is

  • lower tuition fees and a higher number of enrolments in public colleges;
  • lower tuition fees and a lower number of enrolments in private colleges.

Step by step solution

01

Effect of subsidy on tuition fees in public colleges.

The effect of the subsidy on public colleges is explained below using a diagram.

The provision of subsidy is one of the determinants of supply that can shift the supply curve to the right. The subsidy on tuition fees will shift the supply of higher education (number of seats)curve to the right. The demand curve is unaffected.

The supply curve shift reduces the equilibrium level of tuition fees from P to P1 and increases the number of enrollments from Q to Q1,as shown above. Thus, the subsidy increases the enrolment number and reduces the tuition fees in public colleges.

02

Effect of subsidy on tuition fees and enrolment number in private colleges

The indirect effect of the subsidy on private colleges is explained below using a diagram.

Private colleges are considered a replacement for public colleges; they are substitutes of each other. The reduced tuition prices in public colleges encourage potential students to shift to public colleges and reduce their consumption of private colleges. This leads to a backward shift in the demand for seats in private colleges. The supply curve is unaffected.

The demand curve shift changes the equilibrium state. It results in fewer enrolments than before (fall from Q to Q1)and lower tuition fees (fall from P toP1 ). Thus, the subsidy given to public colleges reduces the enrolment and tuition fees in private colleges.

Unlock Step-by-Step Solutions & Ace Your Exams!

  • Full Textbook Solutions

    Get detailed explanations and key concepts

  • Unlimited Al creation

    Al flashcards, explanations, exams and more...

  • Ads-free access

    To over 500 millions flashcards

  • Money-back guarantee

    We refund you if you fail your exam.

Over 30 million students worldwide already upgrade their learning with Vaia!

One App. One Place for Learning.

All the tools & learning materials you need for study success - in one app.

Get started for free

Most popular questions from this chapter

What are the determinants of demand? What happens to the demand curve when any of these determinants change? Distinguish between a change in demand and a movement along a fixed demand curve, noting the cause(s) of each.

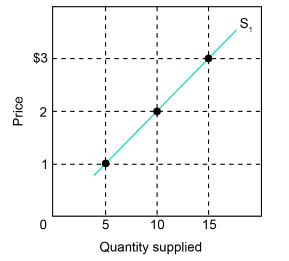
The figure below shows the supply curve for tennis balls, S1, for Drop Volley Tennis, a producer of tennis equipment. Use the figure and the table below to give your answers to the following questions.

a. Use the figure to fill in the quantity supplied on supply curve S1 for each price in the following table.

b. If production costs were to increase, the quantities supplied at each price would be as shown by the third column of the table (“S2 Quantity Supplied”). Use those data to draw supply curve S2 on the same graph as supply curve S1.

c. In the fourth column of the table, enter the amount by which the quantity supplied at each price changes due to the increase in product costs. (Use positive numbers for increases and negative numbers for decreases.)

d. Did the increase in production costs cause a “decrease in supply” or a “decrease in quantity supplied?” Explain.
Price($)S1
Quantity Supplied
S2
Quantity
Supplied
Change in Quantity Supplied (S2-S1)
3-4-
2-2-
1-0-

Assume that demand for a commodity is represented by the equation P = 10 − .2Qd and supply by the equation P = 2 + .2Qs, where Qd and Qs are quantity demanded and quantity supplied, respectively, and P is the price. Using the equilibrium condition Qs = Qd, solve the equations to determine equilibrium price and equilibrium quantity.

What are the determinants of supply? What happens to the supply curve when any of these determinants change? Distinguish between a change in supply and a change in the quantity supplied, noting the cause(s) of each.

In 2001, an outbreak of hoof-and-mouth disease in Europe led to the burning of millions of cattle carcasses. What impact would you expect on the supply of cattle hides, hide prices, the supply of leather goods, and the price of leather goods? Explain.

See all solutions

What do you think about this solution?

We value your feedback to improve our textbook solutions.

Study anywhere. Anytime. Across all devices.

Sign-up for free