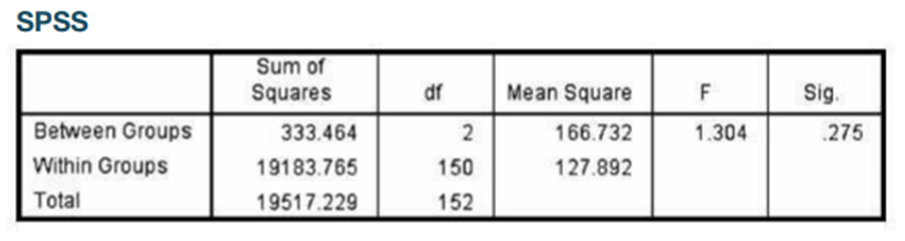
Suppose that a one-way ANOVA is being performed to compare the means of three populations and that the sample sizes are 10,12 , and 15. Determine the degrees of freedom for the F-statistic.

Short Answer

Expert verified

F-statistic (2,34)degrees of freedom

Step by step solution

01

-Introduction 

One way ANOVA:

One-way ANOVA (“ANOVA”) compares the means of two or more independent groups to see if there is statistical evidence of single-factor ANOVA with significantly different relevant population means.

Single Factor ANOVA:

Judge. Analysis of variance (ANOVA) is one of the most commonly used techniques in life and environmental sciences.

02

Step 2- Information

The 3populations to consider is k=3, and the number of observation islocalid="1654190826907" 37, or localid="1654190834085" n=37.

03

Step 3- Explanation

Therefore, the degrees of freedom of the F statistics are as follows:

df=(k-1,n-k)

=(3-1,37-3)

=(2,34)

Unlock Step-by-Step Solutions & Ace Your Exams!

  • Full Textbook Solutions

    Get detailed explanations and key concepts

  • Unlimited Al creation

    Al flashcards, explanations, exams and more...

  • Ads-free access

    To over 500 millions flashcards

  • Money-back guarantee

    We refund you if you fail your exam.

Over 30 million students worldwide already upgrade their learning with Vaia!

One App. One Place for Learning.

All the tools & learning materials you need for study success - in one app.

Get started for free

Most popular questions from this chapter

One vs. Two What is the fundamental difference between one-way analysis of variance and two-way analysis of variance?

Pages were randomly selected by the author from The Bear and the Dragon by Tom Clancy, Harry Potter and the Sorcerer’s Stone by J. K. Rowling, and War and Peace by Leo Tolstoy. The Flesch Reading Ease scores for those pages are listed below. Do the authors appear to have the same level of readability?

Clancy

58.2

73.4

73.1

64.4

72.7

89.2

43.9

76.3

76.4

78.9

69.4

72.9

Rowling

85.3

84.3

79.5

82.5

80.2

84.6

79.2

70.9

78.6

86.2

74.0

83.7

Tolstoy

69.4

64.2

71.4

71.6

68.5

51.9

72.2

74.4

52.8

58.4

65.4

73.6

Male Pulse Rates and Age Using the pulse rates of males from Data Set 1 “Body Data” in Appendix B after they are partitioned into the three age brackets of 18–25, 26–40, and 41–80, we get the following SPSS display. Using a 0.05 significance level, test the claim that males from the three age brackets have the same mean pulse rate. What do you conclude?Male Pulse Rates and Age Using the pulse rates of males from Data Set 1 “Body Data” in Appendix B after they are partitioned into the three age brackets of 18–25, 26–40, and 41–80, we get the following SPSS display. Using a 0.05 significance level, test the claim that males from the three age brackets have the same mean pulse rate. What do you conclude?

Pulse Rates If we use the data given in Exercise 1 with two-way analysis of variance, we get the accompanying display. What do you conclude?

Estimating Length Using the same results displayed in Exercise 8, does it appear that the length estimates are affected by the subject’s major?

See all solutions

Recommended explanations on Math Textbooks

View all explanations

What do you think about this solution?

We value your feedback to improve our textbook solutions.

Study anywhere. Anytime. Across all devices.

Sign-up for free