Consider two χ2curves with degrees of freedom 12and 20respectively. which one more closely resembles a normal curve? Explain your answer.

Short Answer

Expert verified

A 20degrees of freedom of χ2-curve is more closely resembles a normal curve than a12degrees of freedom of χ2-curve.

Step by step solution

01

Step 1. Given information

Consider twoχ2curves with degrees of freedom12and20respectively.

02

Step 2. Explanation for the answer:

We know that, the χ2curves look increasingly like normal curves, when the number of degrees of freedom becomes larger. So, a20degrees of freedom of χ2-curve is more closely resembles a normal curve than a 12degrees of freedom of a χ2curve.

Unlock Step-by-Step Solutions & Ace Your Exams!

  • Full Textbook Solutions

    Get detailed explanations and key concepts

  • Unlimited Al creation

    Al flashcards, explanations, exams and more...

  • Ads-free access

    To over 500 millions flashcards

  • Money-back guarantee

    We refund you if you fail your exam.

Over 30 million students worldwide already upgrade their learning with Vaia!

One App. One Place for Learning.

All the tools & learning materials you need for study success - in one app.

Get started for free

Most popular questions from this chapter

Step 1 of Procedure 13.2 gives generic statements for the null and alternative hypotheses of a chi-square independence test. Use the terms statistically dependent and statistically independent, introduced on page 496, to restate those hypotheses.

In Exercises 12.101-12.106, tase either the critical-value approach or the P-value approach to perform a chi-square homogeneity test, provided the conditions for using the test are met.
12.101 Self-Concept and Sightedness. Self-concept can be defined as the general view of oneself in terms of personal value and capabilities. A study of whether visual impairment affects self-concept was reported in the article "An Exploration into Self Concept: A Comrarative Analysis between the Adolescents Who Are Sighted and
Elind in India" (British Journal of Visual Impairment, Vol. 30, No. 1, of sighted and blind Indian adolescents gave the following data on self-concept.

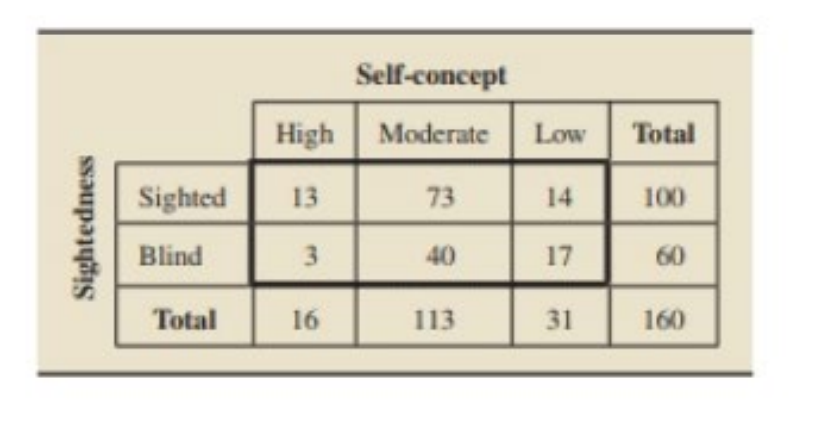
a. At the 5% significance level, do the data provide sufficient evidence to conclude that a difference exists in self-concept distributions between sighted and blind Indian adolescents?
b. Repeat part (a) at the1%significance level.

In each of the given Exercises, we have given the number of possible values for two variables of a population. For each exercise, determine the maximum number of expected frequencies that can be less than 5 in order that Assumption 2 of Procedure 12.2 on page 506 to be satisfied. Note: The number of cells for a contingency table with m rows and n columns is m⋅n.

12.69 four and five

In Example 12.9 , we made the following statement: If no association exists between marital status and alcohol consumption, the proportion of married adults who abstain is the same as the proportion of all adults who abstain. Explain why that statement is true.

What is meant by saying that a variable has a chi-square distribution?

See all solutions

Recommended explanations on Math Textbooks

View all explanations

What do you think about this solution?

We value your feedback to improve our textbook solutions.

Study anywhere. Anytime. Across all devices.

Sign-up for free