For each exercise, decide, at 10% significance level, whether the data provide sufficient evidence t reject the null hypothesis in favour of alternate hypothesis

Ha :p<0

Short Answer

Expert verified

We don't reject Ha : p<0and state that variables are negatively linearly correlated

Step by step solution

01

Correlation Coefficient 

Sample correlation coefficientr is calculated :

where , and same for

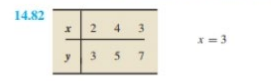
Using excel and above formula concept ,r = -0.7559

02

Hypothesis Testing 

r negative (r<0) for sample needs to be tested using hypothesis testing, to ensure that the population correlation parameter p(rho) is negative

t=-0.7559/(1-0.5714)/(3-2)t=-0.7559/0.4286t=-0.7559/0.6547t=-1.1546

As t calculated value is more than tabulated t value at 0.10 significance level, and p value at the same corresponding level = 0.454

So, we reject the null hypothesis that p = 0, and don't reject the alternate hypothesis that p < 0

Unlock Step-by-Step Solutions & Ace Your Exams!

  • Full Textbook Solutions

    Get detailed explanations and key concepts

  • Unlimited Al creation

    Al flashcards, explanations, exams and more...

  • Ads-free access

    To over 500 millions flashcards

  • Money-back guarantee

    We refund you if you fail your exam.

Over 30 million students worldwide already upgrade their learning with Vaia!

One App. One Place for Learning.

All the tools & learning materials you need for study success - in one app.

Get started for free

Most popular questions from this chapter

In Exercises 14.12-14.21, we repeat the data and provide the sample regression equations for Exercises 4.48 -4.57.

a. Determine the standard error of the estimate.

b. Construct a residual plot.

c. Construct a normal probability plot of the residuals.

y^=2.8750.625x

U.S. Presidents. The Information Please Almanac provides data on the ages at the inauguration and death of the presidents of the United States. We give those data on the WeissStats site for those residents who are not still living at the time of this writing.

Which graph used in a residual analysis provides roughly the same information as a scatterplot? What advantages does it have over a scatterplot?

In Exercises 14.98-14.108, use the technology of your choice to do the following tasks.
a. Decide whether your can reasonably apply the conditional mean and predicted value t-interval procedures to the data. If so, then also do parts (b) - (h).
b. Determine and interpret a point estimate for the conditional mean of the response variable corresponding to the specified value of the predictor variable.
c. Find and interpret a 95%Te confidence interval for the conditional mean of the response variable corresponding to the specified value of the predictor variable.
d. Determine and interpret the predicted value of the response variable corresponding to the specified value of the predictor variable.
e. Find and interpret a 95%prediction interval for the value of the response variable corresponding to the specified value of the predictor variable.
f. Compare and discuss the differences between the confidence interval that you obtained in part (c) and the prediction interval that you obtained in part (e).

14.10 PCBs and Pelicans. The data from Exercise 14.40for shell thickness and concentration of PCBs of 60Anacapa pelican eggs are on the WeissStats site. Specified value of the predictor variable: 220ppm.


Find a95%prediction interval for the value of the response variable corresponding to the specified value of the predictor variable.

a. Obtain a point estimate for the mean tax efficiency of all mutual fund portfolios with6%of their investments in energy securities.

b. Determine a95%confidence interval for the mean tax efficiency of all mutual fund portfolios with6%of their investments in energy securities.

c. Find the predicted tax efficiency of a mutual fund portfolio with 6%of its investments in energy securities.

d. Determine a 95%prediction interval for the tax efficiency of a mutual fund portfolio with 6%of its investments in energy securities.

See all solutions

Recommended explanations on Math Textbooks

View all explanations

What do you think about this solution?

We value your feedback to improve our textbook solutions.

Study anywhere. Anytime. Across all devices.

Sign-up for free