Chapter 2: Q.2.91 (page 70)
In the article "Distribution of Oxygen in Surface Sediments from Central Sagami Bay, Japan: In Situ Measurements by Microelectrodes and Planar Optodes" (Deep Sea Research Part I: Oceanographic Research Papers, Vol. 52, Issue 10, pp. 1974-1987), R. Glud et al. explored the distributions of oxygen in surface sediments from central Sagami Bay. The oxygen distribution gives important information on the general biogeochemistry of marine sediments. Measurements were performed at 16 sites. A sample of 22 depths yielded the following data, in millimoles per square meter per day, on diffusive oxygen uptake. Use cutpoint grouping with a first class of 0 -under 1 .

a. determine a frequency distribution.
b. obtain a relative-frequency distribution.
c. construct a frequency histogram based on your result from part (a).
d. construct a relative-frequency histogram based on your result from part (b).
Short Answer
(a)
(b)
(c)
(d)
Step by step solution
Part (a)Step 1: Given information
Given in the question that, In the article "Distribution of Oxygen in Surface Sediments from Central Sagami Bay, Japan: In Situ Measurements by Microelectrodes and Planar Optodes" (Deep Sea Research Part I: Oceanographic Research Papers, Vol. 52, Issue 10, pp. 1974-1987), R. Glud et al. explored the distributions of oxygen in surface sediments from central Sagami Bay. The oxygen distribution gives important information on the general biogeochemistry of marine sediments. Measurements were performed at 16 sites. A sample of 22 depths yielded the following data, in millimoles per square meter per day, on diffusive oxygen uptake. Use cutpoint grouping with a first class of 0 -under 1 .
We need to determine a frequency distribution.
Part(a) Step 2: Explanation
The given data is,
The number of values that fall between the class's bounds is the frequency.
The data's frequency distribution is as follows:
Part(b) Step 1: Given information
Given in the question that, In the article "Distribution of Oxygen in Surface Sediments from Central Sagami Bay, Japan: In Situ Measurements by Microelectrodes and Planar Optodes" (Deep Sea Research Part I: Oceanographic Research Papers, Vol. 52, Issue 10, pp. 1974-1987), R. Glud et al. explored the distributions of oxygen in surface sediments from central Sagami Bay. The oxygen distribution gives important information on the general biogeochemistry of marine sediments. Measurements were performed at 16 sites. A sample of 22 depths yielded the following data, in millimoles per square meter per day, on diffusive oxygen uptake. Use cutpoint grouping with a first class of 0 -under 1 .
We need to obtain a relative-frequency distribution.
Part (b) Step 2: Explanation
The given data is,
The frequency is divided by the overall frequency to get the relative frequency.
The data's relative frequency distribution is as follows:
Part(c) Step 1: Given information
Given in the question that, In the article "Distribution of Oxygen in Surface Sediments from Central Sagami Bay, Japan: In Situ Measurements by Microelectrodes and Planar Optodes" (Deep Sea Research Part I: Oceanographic Research Papers, Vol. 52, Issue 10, pp. 1974-1987), R. Glud et al. explored the distributions of oxygen in surface sediments from central Sagami Bay. The oxygen distribution gives important information on the general biogeochemistry of marine sediments. Measurements were performed at 16 sites. A sample of 22 depths yielded the following data, in millimoles per square meter per day, on diffusive oxygen uptake. Use cutpoint grouping with a first class of 0 -under 1 .
We need to construct a frequency histogram based on the result from part (a)
Part(c) Step 2: Explanation
The given data is,
On a horizontal axis, the histogram shows the quantitative data classes, and on a vertical axis, the frequencies of those classes.
The bars must all be the same width and must be bordered by the lower class limitations.
The frequency must be represented by the height of the bars.
The frequency distribution histogram is shown below:

Part(d) Step 1: Given information
Given in the question that, In the article "Distribution of Oxygen in Surface Sediments from Central Sagami Bay, Japan: In Situ Measurements by Microelectrodes and Planar Optodes" (Deep Sea Research Part I: Oceanographic Research Papers, Vol. 52, Issue 10, pp. 1974-1987), R. Glud et al. explored the distributions of oxygen in surface sediments from central Sagami Bay. The oxygen distribution gives important information on the general biogeochemistry of marine sediments. Measurements were performed at 16 sites. A sample of 22 depths yielded the following data, in millimoles per square meter per day, on diffusive oxygen uptake. Use cutpoint grouping with a first class of 0 -under 1 .
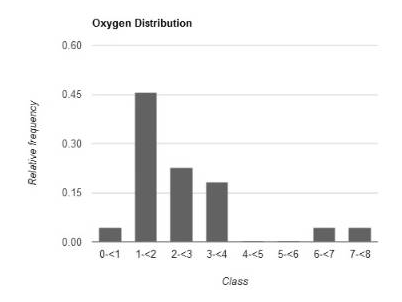
We need to construct a relative-frequency histogram based on the result from part (b)
Part(d) Step 2: Explanation
The given data is,
On a horizontal axis, the histogram shows the quantitative data classes, and on a vertical axis, the frequencies of those classes.
The bars must all be the same width and must be bordered by the lower class limitations.
The frequency must be represented by the height of the bars.
The relative frequency distribution histogram is shown below:

Over 30 million students worldwide already upgrade their learning with Vaia!


