Use the “Initial Public Offering” data (see Appendix C) to test the claim that the mean offer price was \(\$18\) per share.

Do not use all the data. Use your random number generator to randomly survey \(15\) prices.

Short Answer

Expert verified

The hypothesis test has resulted in p-value less than alpha value and hence the null hypothesis is rejected therefore the alternate hypothesis which states that the mean offer price is different from \(\$18\) per share remains true.

Step by step solution

01

Step 1. Given information

As per the information, I have to use the IPO data from appendix C to test the claim that the mean offer price is \(\$18\) per share. I have to randomly choose \(15\) prices from the data to do the hypothesis testing.

Hypothesis test is usually performed on a sample data taken from larger population. This test is used to obtain results based on a hypothesis performed on the sample data. Usually the analysts perform this test to determine whether his hypothesis is true or false.

Null hypothesis states that there is no statistical connection between two variables and hence the researcher always uses this to disapprove the inference. Alternate hypothesis states that there is a significant relationship between two variables.

Student’s t-distribution is also a part of continuous probability distribution methods which is used when the standard deviation value is unknown and the sample size for any given population is more than or equal to \(30\). This method is used again when the population is normally distributed for any sample size and the values of standard deviation is unknown.

02

Step 2. Calculation

First let us determine the null and alternate hypothesis:

Null hypothesis states that the mean offer price is \(\$18\) per share and the alternate hypothesis states that the mean offer price is different from \(\$18\0 per share.

\(H_{0}:\mu=18\)

\(H_{a}:\mu\neq 18\)

Here the random variable which is \(\bar{X}\), the mean offer price per share. Since we do not know the population standard deviation we use student’s t-distribution for this test.

\(t_{n-1}=t_{15-1}\)

\(=t_{14}\)

Thus the \(t\) test statistic is calculated using the following formula:

\(t=\frac{\bar{X}-\mu}{s/\sqrt{n}}\)

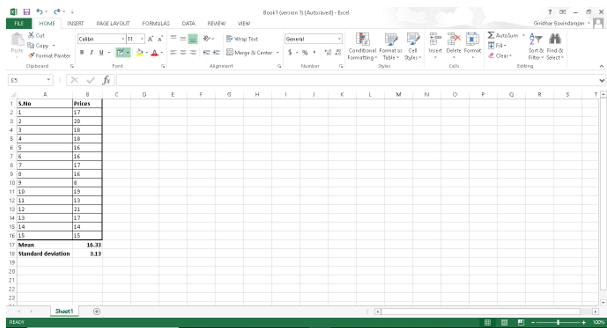
Here \(\bar{X}\) is the sample mean and \(\mu\) is the population mean, \(s\) is the standard deviation and n is the sample size. Now the randomly chosen \(15\) prices from appendix C is entered in Excel to calculate mean and standard deviation. The mean is calculated using the function =average ( ) and the standard deviation is calculate using the function =stdev ( ).

Therefore let us calculate t value in the t test statistic formula

\(t=\frac{\bar{X}-\mu}{s/\sqrt{n}}\)

\(=\frac{16.33-18}{3.13\sqrt{15}}\)

\(=\frac{-1.67}{3.13/3.8729}\)

\(=\frac{-1.69}{0.808}\)

\(=-2.066\)

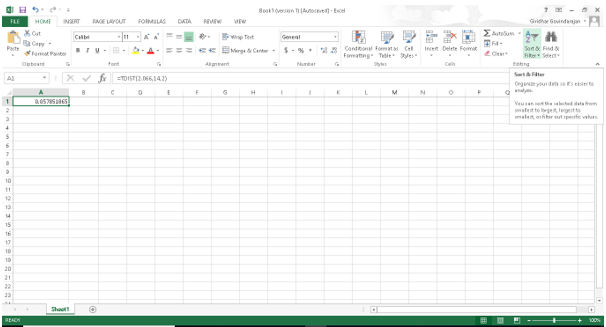
After this step let us find the r-value using TDISTfunction in excel.

Thus the following is the student’s t-distribution curve for the hypothesis test.

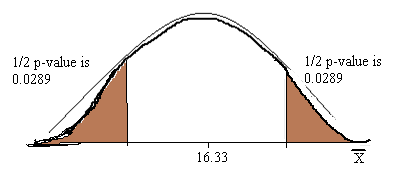
We know that alpha value is \(0.05\) and the \(p-\)value is less than the alpha value therefore the null hypothesis is rejected. Since null hypothesis is rejected we accept the alternate hypothesis since we have enough evidence to state that the mean offer price is different from \($18\) per share.

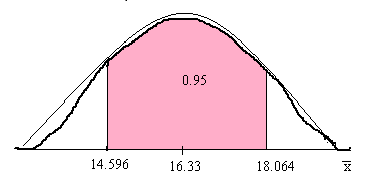
Now let us determine the \(95%\) confidence interval:

Thus the \(95%\) confidence level indicates that the mean offer price per share lies within \(14.596\) and \(18.064\). Let us represent the same in the student’s t-distribution curve

Unlock Step-by-Step Solutions & Ace Your Exams!

  • Full Textbook Solutions

    Get detailed explanations and key concepts

  • Unlimited Al creation

    Al flashcards, explanations, exams and more...

  • Ads-free access

    To over 500 millions flashcards

  • Money-back guarantee

    We refund you if you fail your exam.

Over 30 million students worldwide already upgrade their learning with Vaia!

One App. One Place for Learning.

All the tools & learning materials you need for study success - in one app.

Get started for free

Most popular questions from this chapter

"Red tide" is a bloom of poison-producing algae-a few different species of a class of plankton called dinoflagellates. When the weather and water conditions cause these blooms, shellfish such as clams living in the area develop dangerous levels of a paralysis-inducing toxin. In Massachusetts, the Division of Marine Fisheries (DMF) monitors levels of the toxin in shellfish by regular sampling of shellfish along the coastline. If the mean level of toxin in clams exceeds 800μg(micrograms) of toxin per kg of clam meat in any area, clam harvesting is banned there until the bloom is over and levels of toxin in clams subside. Describe both a TypeI and a Type IIerror in this context, and state which error has the greater consequence.

State the Type I and Type II errors in complete sentences given the following statements.

a. The mean number of years Americans work before retiring is 34.

b. At most 60% of Americans vote in presidential elections.

c. The mean starting salary for San Jose State University graduates is at least \(100,000 per year.

d. Twenty-nine percent of high school seniors get drunk each month.

e. Fewer than 5% of adults ride the bus to work in Los Angeles.

f. The mean number of cars a person owns in his or her lifetime is not more than ten.

g. About half of Americans prefer to live away from cities, given the choice.

h. Europeans have a mean paid vacation each year of six weeks.

i. The chance of developing breast cancer is under 11% for women.

j. Private universities mean tuition cost is more than \)20,000 per year.

"Asian Family Reunion," by Chau Nguyen every two years it comes around. We all get together from different towns. In my honest opinion, It's not a typical family reunion. Not forty, or fifty, or sixty, But how about seventy companions! The kids would play, scream, and shout One minute they're happy, another they'll pout. The teenagers would look, stare, and compare from how they look to what they wear. The men would chat about

their business . That they make more, but never less. Money is always their subject and there's always talk of more new projects. The women get tired from all of the chats. They head to the kitchen to set out the mats. Some would sit and some would stand eating and talking with plates in their hands. Then come the games and the songs and suddenly, everyone gets along! With all that laughter, it's sad to say that it always ends in

the same old way. They hug and kiss and say "good-bye" and then they all begin to cry! I say that 60 percent shed their tears but my mom counted 35 people this year. She said

that boys and men will always have their pride, so we won't ever see them cry. I myself don't think she's correct, so could you please try this problem to see if you object?

According to the N.Y. Times Almanac the mean family size in the U.S. is 3.18. A sample of a college math class resulted in the following family sizes:

5;4;5;4;4;3;6;4;3;3;5;5;6;3;3;2;7;4;5;2;2;2;3;2

At α=0.05 level, is the class’ mean family size greater than the national average? Does the Almanac result remain valid? Why?

Draw the graph of a two-tailed test.

See all solutions

Recommended explanations on Math Textbooks

View all explanations

What do you think about this solution?

We value your feedback to improve our textbook solutions.

Study anywhere. Anytime. Across all devices.

Sign-up for free