Specify the differences between a large-sample and a small-sample test of a hypothesis about a population mean m. Focus on the assumptions and test statistics.

Short Answer

Expert verified

A large-sample, as well as a small-sample hypothesis test of a population, mean, μvary because a large sample can be considered to be typically disturbed.

Step by step solution

01

Hypothesis

A hypothesis is an assumption formed based on facts. This is the first step in every inquiry that converts research issues into forecasts. It consists of variables, a population, as well as the relationship among the variables. A research hypothesis is a theory used to evaluate the link among two or more variables.

02

Explanation

In a population's large-sample and small-sample hypothesis tests, the mean varies because a large sample can be considered typically disturbed. As a result, one can use a normally distributed area to conduct an extensive sample hypothesis test. However, this assumption may not remain valid for a smaller sample. Therefore we utilize the t distribution for a minor sample hypothesis test.

Unlock Step-by-Step Solutions & Ace Your Exams!

  • Full Textbook Solutions

    Get detailed explanations and key concepts

  • Unlimited Al creation

    Al flashcards, explanations, exams and more...

  • Ads-free access

    To over 500 millions flashcards

  • Money-back guarantee

    We refund you if you fail your exam.

Over 30 million students worldwide already upgrade their learning with Vaia!

One App. One Place for Learning.

All the tools & learning materials you need for study success - in one app.

Get started for free

Most popular questions from this chapter

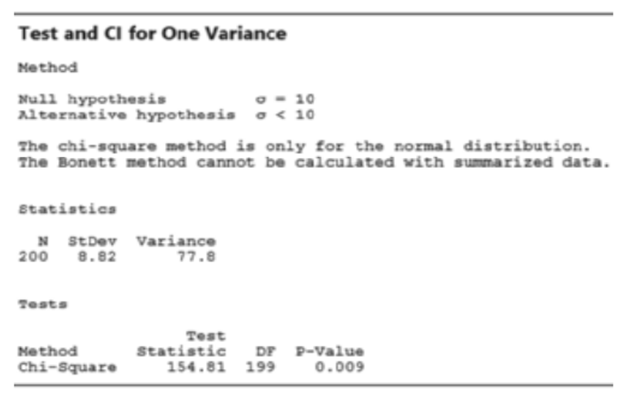
Trading skills of institutional investors. Refer to The Journal of Finance (April 2011) analysis of trading skills of institutional investors, Exercise 7.36 (p. 410). Recall that the study focused on “round-trip” trades, i.e., trades in which the same stock was both bought and sold in the same quarter. In a random sample of 200 round-trip trades made by institutional investors, the sample standard deviation of the rates of return was 8.82%. One property of a consistent performance of institutional investors is a small variance in the rates of return of round-trip trades, say, a standard deviation of less than 10%.

a. Specify the null and alternative hypotheses for determining whether the population of institutional investors performs consistently.

b. Find the rejection region for the test usingα=.05

c. Interpret the value of in the words of the problem.

d. A Minitab printout of the analysis is shown (next column). Locate the test statistic andp-value on the printout.

e. Give the appropriate conclusion in the words of the problem.

f. What assumptions about the data are required for the inference to be valid?

a. List three factors that will increase the power of a test.

b. What is the relationship between b, the probability of committing a Type II error, and the power of a test?

Ages of cable TV shoppers. Cable TV’s Home Shopping Network (HSN) reports that the average age of its shoppers is 52 years. Suppose you want to test the null hypothesis,\({H_0}:\mu = 52\), using a sample of\(n = 50\) cable TV shoppers.

a. Find the p-value of a two-tailed test if\(\overline x = 53.3\)and\(s = 7.1\)

b. Find the p-value of an upper-tailed test if\(\overline x = 53.3\)and\(s = 7.1\)

c. Find the p-value of a two-tailed test if\(\overline x = 53.3\)and\(s = 10.4\)

d. For each of the tests, parts a–c, give a value of\(\alpha \)that will lead to a rejection of the null hypothesis.

e. If\(\overline x = 53.3\), give a value of s that will yield a two-tailed p-value of 0.01 or less.

Which of the elements of a test of hypothesis can and should be specified prior to analyzing the data that are to be used to conduct the test

Solder-joint inspections. Current technology uses high-resolution X-rays and lasers to inspect solder-joint defects on printed circuit boards (PCBs) (Global SMT & Packaging, April 2008). A particular manufacturer of laser-based inspection equipment claims that its product can inspect, on average, at least 10 solder joints per second when the joints are spaced .1 inch apart. The equipment was tested by a potential buyer on 48 different PCBs. In each case, the equipment was operated for exactly 1 second. The number of solder joints inspected on each run follows:

The potential buyer wants to know whether the sample data refute the manufacturer’s claim. Specify the null and alternative hypotheses that the buyer should test.

See all solutions

Recommended explanations on Math Textbooks

View all explanations

What do you think about this solution?

We value your feedback to improve our textbook solutions.

Study anywhere. Anytime. Across all devices.

Sign-up for free