Question: A random sample of n measurements was selected from a population with unknown meanμand known standard deviationσ2. Calculate a 95% confidence interval forαfor each of the following situations:

a. n = 75, X = 28,σ2= 12

b. n = 200, X= 102, σ2= 22

c. n = 100, X= 15,σ2=.3

d. n = 100, X= 4.05, σ2= .83

e. Is the assumption that the underlying population of measurements is normally distributed necessary to ensure the validity of the confidence intervals in parts a–d? Explain.

Short Answer

Expert verified

Answer

a.(28.4±27.6)b.(102.33±101.67)c.(100.0588±99.9412)d.(100.16268±99.83732)e.No

Step by step solution

01

Step 1: Computing μ  when n is 75, x is 28 and σ2 is 12

a.

As the confidence interval is 95%, the significance level will be 5% which means 0.05.

Therefore,α2=0.052

=0.025

. Now the value of zα2can be found from the z table and so the values is 1.96.

The margin of error is calculated below:

The calculation of the confidence intervals of the boundaries are calculated below:

02

Step 1: Computing μ  when n is 200, x is 102 and σ2 is 21

b.

As the confidence interval is 95%, the significance level will be 5% which means 0.05.

Therefore,α2=0.052

=0.025

. Now the value of can be found from the z table and so the values is 1.96.

The margin of error is calculated below:

The calculation of the confidence intervals of the boundaries are calculated below:

03

Step 1: Computing μ  when n is 100, x is 15 and σ2 is 0.3

c

As the confidence interval is 95%, the significance level will be 5% which means 0.05.

Therefore,α2=0.052

=0.025

. Now the value of can be found from the z table and so the values is 1.96.

The margin of error is calculated below:

The calculation of the confidence intervals of the boundaries are calculated below:

04

Step 1: Computing μ  when n is 100, x is 4.05 and σ2 is 0.83

d.

As the confidence interval is 95%, the significance level will be 5% which means 0.05.

Therefore,α2=0.052

=0.025

.

Now the value ofZα2can be found from the z table and so the values is 1.96.

The margin of error is calculated below:

The calculation of the confidence intervals of the boundaries are calculated below:

05

Determination of the validity of the assumption 

e.

The answer is no in this case. According to the theory of central limit theorem, the sample mean remains exactly normal. This applies specifically for the large samples where the size remains above 30.

Unlock Step-by-Step Solutions & Ace Your Exams!

  • Full Textbook Solutions

    Get detailed explanations and key concepts

  • Unlimited Al creation

    Al flashcards, explanations, exams and more...

  • Ads-free access

    To over 500 millions flashcards

  • Money-back guarantee

    We refund you if you fail your exam.

Over 30 million students worldwide already upgrade their learning with Vaia!

One App. One Place for Learning.

All the tools & learning materials you need for study success - in one app.

Get started for free

Most popular questions from this chapter

“Out of control” production processes. When companies employ control charts to monitor the quality of their products, a series of small samples is typically used to determine if the process is “in control” during the period of time in which each sample is selected. (We cover quality-control charts in Chapter 13.) Suppose a concrete-block manufacturer samples nine blocks per hour and tests the breaking strength of each. During 1 hour’s test, the mean and standard deviation are 985.6 pounds per square inch (psi) and 22.9 psi, respectively. The process is to be considered “out of control” if the true mean strength differs from 1,000 psi. The manufacturer wants to be reasonably certain that the process is really out of control before shutting down the process and trying to determine the problem. What is your recommendation?

Bacteria in bottled water. Is the bottled water you drinksafe? The Natural Resources Defense Council warns thatthe bottled water you are drinking may contain morebacteria and other potentially carcinogenic chemicals thanallowed by state and federal regulations. Of the more than1,000 bottles studied, nearly one-third exceeded governmentlevels (www.nrdc.org). Suppose that the NaturalResources Defense Council wants an updated estimate ofthe population proportion of bottled water that violates atleast one government standard. Determine the sample size(number of bottles) needed to estimate this proportion towithin 0.01 with 99% confidence.

Corporate sustainability of CPA firms. Refer to the Business and Society (March 2011) study on the sustainability behaviors of CPA corporations, Exercise 6.12 (p. 339). Recall that the level of support for corporate sustainability (measured on a quantitative scale ranging from 0 to 160 points) was obtained for each in a sample of 992 senior managers at CPA firms. The accompanying Minitab printout gives 90% confidence intervals for both the variance and standard deviation of level of support for all senior managers at CPA firms.
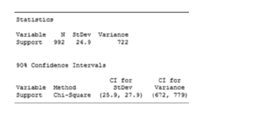
a. Locate the 90% confidence interval for σ2on the printout. Interpret the result. b. Use the sample variance on the printout to calculate the 90% confidence interval forσ2. Does your result agree with the interval shown on the printout?

c. Locate the 90% confidence interval for on the printout.

d. Use the result, part a, to calculate the 90% confidence interval forσ. Does your result agree with the interval shown on the printout?

e. Give a practical interpretation of the 90% confidence interval for.σ

f. What assumption about the distribution of level of support is required for the inference, part e, to be valid? Is this assumption reasonably satisfied? (Use your answer to Exercise 4.125, p. 270.)

Crash risk of using cell phones while driving. Studies have shown that drivers who use cell phones while operating a motor passenger vehicle increase their risk of an accident. To quantify this risk, the New England Journal of Medicine (January 2, 2014) reported on the risk of a crash (or near crash) for both novice and expert drivers when using a cell phone. In a sample of 371 cases of novices using a cell phone while driving, 24 resulted in a crash (or near crash). In a sample of 1,467 cases of experts using a cell phone while driving, 67 resulted in a crash (or near crash).

a. Give a point estimate of p, the true crash risk (probability) for novice drivers who use a cell phone while driving.

b. Find a 95% confidence interval for p.

c. Give a practical interpretation of the interval, part b.

d. Repeat parts a–c for expert drivers.

Question: For the binomial sample information summarized in each part, indicate whether the sample size is large enough to use the methods of this chapter to construct a confidence interval for p.

a. n = 400,p^= .10

b. n = 50,p^= .10

c. n = 20,p^= .5

d. n = 20,p^= .3

See all solutions

Recommended explanations on Math Textbooks

View all explanations

What do you think about this solution?

We value your feedback to improve our textbook solutions.

Study anywhere. Anytime. Across all devices.

Sign-up for free