Question: State SAT scores.Refer to Exercise 2.27 (p. 84) and the data on state SAT scores. Construct a scatterplot for the data, with the 2010 Math SAT score on the horizontal axis and the 2014 Math SAT score on the vertical axis. What type of trend do you detect?

State

2010 Math SAT

2014 Math SAT

Alabama

538

550

Alaska

503

513

Arizona

527

524

Arkansa

571

564

California

510

516

Wisconsin

608

603

Wyoming

599

565

Short Answer

Expert verified

Answer:

The image is given below:

There is an upward sloping positive trend.

Step by step solution

01

Constructing the scatterplot

We will plot the 2010 SAT Scores on the X-axis and 2014 SAT scores on the Y-axis.

The graph is given below:

02

Detecting the trend 

There is a positive trend in the Math SAT scores. States who have performed well in 2010 have also performed well in 2014 and are towards the top right corner of the graph.

States that have performed poorly in 2010 have also performed poorly in 2014 and lie on the bottom left of the graph.

This has created an upward slope.Therefore, there is an upward trend in the data.

Unlock Step-by-Step Solutions & Ace Your Exams!

  • Full Textbook Solutions

    Get detailed explanations and key concepts

  • Unlimited Al creation

    Al flashcards, explanations, exams and more...

  • Ads-free access

    To over 500 millions flashcards

  • Money-back guarantee

    We refund you if you fail your exam.

Over 30 million students worldwide already upgrade their learning with Vaia!

One App. One Place for Learning.

All the tools & learning materials you need for study success - in one app.

Get started for free

Most popular questions from this chapter

Treating psoriasis with the “Doctorfish of Kangal.”Psoriasis is a skin disorder with no known cure and noproven effective pharmacological treatment. An alternative treatment for psoriasis is ichthyotherapy, also known as therapy with the “Doctorfish of Kangal.” Fish from the hot pools of Kangal, Turkey, feed on the skin scales of bathers, reportedly reducing the symptoms of psoriasis. In one study, 67 patients diagnosed with psoriasis underwent 3 weeks of ichthyotherapy (Evidence-Based Research in Complementary and Alternative Medicine,December 2006). The Psoriasis Area Severity Index (PASI) of each patient was measured both before and after treatment. (The lower the PASI score, the better is the skin condition.) Box plots of the PASI scores, both before (baseline) and after 3 weeks of ichthyotherapy treatment, are shown in the accompanying diagram.
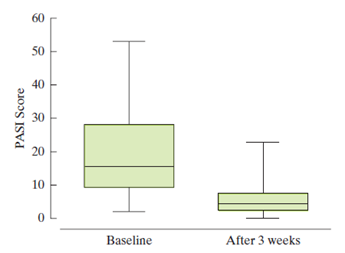
a.Find the approximate 25th percentile, the median, and the 75th percentile for the PASI scores before treatment.

b.Find the approximate 25th percentile, the median, and the 75th percentile for the PASI scores after treatment.

c.Comment on the effectiveness of ichthyotherapy in treating psoriasis.

Time in bankruptcy.Refer to the Financial Management(Spring 1995) study of 49 firms filing for prepackagedbankruptcies, Exercise 2.32 (p. 86). Recall that three typesof “prepack” firms exist: (1) those who hold no prefilingvote, (2) those who vote their preference for a joint solution;and (3) those who vote their preference for a prepack.

a.Construct a box plot for the time in bankruptcy (months) for each type of firm.

b.Find the median bankruptcy times for the three types.

c.How do the variabilities of the bankruptcy times compare for the three types?

d.The standard deviations of the bankruptcy times are 2.47 for “none,” 1.72 for “joint,” and 0.96 for “prepack.” Do the standard deviations agree with the interquartile ranges concerning the comparison of the variabilities of the bankruptcy times?

e.Is there evidence of outliers in any of the three distributions?

Ranking driving performance of professional golfers.A group of researchers developed a new method forranking the total driving performance of golfers on theProfessional Golf Association (PGA) tour (The Sport Journal,Winter 2007). The method requires knowinga golfer’s average driving distance (yards) and drivingaccuracy (percent of drives that land in the fairway).The values of these two variables are used to compute adriving performance index. Data for 40 PGA golfers (asranked by the new method for a recent tour year) aresaved in the accompanying file. The first five and last fiveobservations are listed in the table below.

a.Find the mean, median, and mode for the 40 driving performance index values.

b.Interpret each of the measures of central tendency, part a.

c.Use the results, part a,to make a statement about the type of skewness in the distribution of driving performance indexes. Support your statement with a graph.

Consider the horizontal box plot shown below.


a.What is the median of the data set (approximately)?

b.What are the upper and lower quartiles of the data set (approximately)?

c.What is the interquartile range of the data set (approximately)?

d.Is the data set skewed to the left, skewed to the right, or symmetric?

e.What percentage of the measurements in the data set lie to the right of the median? To the left of the upper quartile?

f.Identify any outliers in the data.

Question: Hotels’ use of ecolabels.Refer to the Journal of Vacation Marketing(January 2016) study of travelers’ familiaritywith ecolabels used by hotels, Exercise 2.42 (p. 94). Recallthat a sample of 392 adult travelers were shown a list of6 different ecolabels, and asked, “How familiar are youwith this ecolabel, on a scale of 1 (not familiar at all) to5 (very familiar).” The mean and standard deviation ofthe responses for each ecolabel are provided in the table.Which of the ecolabels had the most variation in numericalresponses? Explain.

Ecolabel

Mean

Std. Dev.

Energy Star

4.44

0.82

TripAdvisor

3.57

1.38

Green Leaders Audubon

2.41

1.44

International U.S Green

2.28

1.39

Building Council Green Business

2.25

1.39

Green Key

2.01

1.30

See all solutions

Recommended explanations on Math Textbooks

View all explanations

What do you think about this solution?

We value your feedback to improve our textbook solutions.

Study anywhere. Anytime. Across all devices.

Sign-up for free