Calculate the range, variance, and standard deviation for the following samples:

a.39, 42, 40, 37, 41

b.100, 4, 7, 96, 80, 3, 1, 10, 2

c.100, 4, 7, 30, 80, 30, 42, 2

Short Answer

Expert verified
  1. Range = 5, Variance = 3.79, Standard Deviation = 1.95
  2. Range = 99, Variance = 1949.25, Standard Deviation = 44.15
  3. Range = 98, Variance = 1307.839, Standard Deviation = 36.16

Step by step solution

01

Calculating the range, variance and standard deviation for a

39, 42, 40, 37, 41

Range = 42 – 37 = 5

x

2

39

-0.8

0.64

42

2.2

4.84

40

0.2

0.4

37

-2.8

7.84

41

1.2

1.44

Sum

0

15.16

Mean(x¯)=sumofxn=1995=39.8

Variance=(x-x¯)2n-1=15.165-1=15.164=3.79

StandardDeviation=Variance=3.79=1.95

Therefore,the variance and standard deviation are 3.79 and 1.95 respectively.

02

Finding the range, variance and standard deviation for b

100, 4, 7, 96, 80, 3, 1, 10, 2

Range = 100 – 1 = 99

x

2

100

66.33

4400.11

4

-29.67

880.11

7

-26.67

711.11

96

62.33

3885.44

80

46.33

2146.778

3

-30.67

940.44

1

-32.67

1067.11

10

-23.67

560.11

2

-31.67

1002.778

Sum

0

15594

Mean(x¯)=sumofxn=3019=33.66

Variance=(x-x¯)2n-1=155949-1=155948=1949.25

StandardDeviation=Variance=1949.25=44.15

Therefore, Variance = 1949.25 and Standard Deviation = 44.15

03

Computing the range, variance and standard deviation for c

100, 4, 7, 30, 80, 30, 42, 2

Range = 100 – 2 = 98

x

2

100

63.125

3984.766

4

-32.875

1080.766

7

-29.875

892.5156

30

-6.875

47.26563

80

43.125

1859.766

30

-6.875

47.26563

42

5.125

26.26563

2

-34.875

1216.266

Sum

0

9154.875

Mean(x¯)=sumofxn=2958=36.875

Variance=(x-x¯)2n-1=9154.8758-1=9154.8757=1307.839

StandardDeviation=Variance=1307.839=36.16

Hence, thevariance is 1307.839 and standard deviation is 36.16.

Unlock Step-by-Step Solutions & Ace Your Exams!

  • Full Textbook Solutions

    Get detailed explanations and key concepts

  • Unlimited Al creation

    Al flashcards, explanations, exams and more...

  • Ads-free access

    To over 500 millions flashcards

  • Money-back guarantee

    We refund you if you fail your exam.

Over 30 million students worldwide already upgrade their learning with Vaia!

One App. One Place for Learning.

All the tools & learning materials you need for study success - in one app.

Get started for free

Most popular questions from this chapter

Do social robots walk or roll? A social (or service) robot is designed to entertain, educate, and care for human users. In a paper published by the International Conference on Social Robotics (Vol. 6414, 2010), design engineers investigated the trend in the design of social robots. Using a random sample of 106 social robots obtained through a Web search, the engineers found that 63 were built with legs only, 20 with wheels only, 8 with both legs and wheels, and 15 with neither legs nor wheels. This information is portrayed in the accompanying graph.
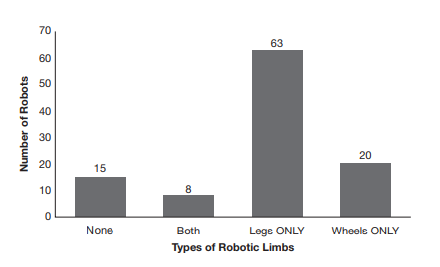
a. What type of graph is used to describe the data?

b. Identify the variable measured for each of the 106 robot designs.

c. Use the graph to identify the social robot design that is currently used the most.

d. Compute class relative frequencies for the different categories shown in the graph.

e. Use the results from part d to construct a Pareto diagram for the data.

Question: In business, do nice guys really finish last?Do “nice guys finish last” in the competitive corporate world? In a study published in Nature(March 20, 2008), college students repeatedly played a version of the game “prisoner’s dilemma,” where competitors choose cooperation, defection, or costly punishment. (Cooperation meant paying 1 unit for the opponent to receive 2 units; defection meant gaining 1 unit at a cost of 1 unit for the opponent, and punishment meant paying 1 unit for the opponent to lose 4 units.) At the conclusion of the games, the researchers recorded the average payoff and the number of times punishment was used against each player. A graph of the data

is shown in the accompanying scatterplot. Does it appear that average payoff is associated with punishment use? The researchers concluded that “winners don’t punish.” Do you agree? Explain.

Salary offers to MBAs.Consider the top salary offer (in thousands of dollars) received by each member of a sample of 50 MBA students who graduated from the Graduate School of Management at Rutgers, the state university of New Jersey. Descriptive statistics and a box plot for the data are shown on the XLSTAT printouts at the top of the next column. [Note:The “+” on the box plot represents the location of the mean.]

a.Find and interpret the z-score associated with the highest salary offer, the lowest salary offer, and the mean salary offer. Would you consider the highest offer to be unusually high? Why or why not?

b.Based on the box plot for this data set, which salary offers (if any) are suspect or highly suspect outliers?

Ranking driving performance of professional golfers.Refer to The Sport Journal(Winter 2007) analysis of anew method for ranking the total driving performance ofgolfers on the PGA tour, Exercise 2.52 (p. 97). Recall thatthe method uses both the average driving distance (yards)and driving accuracy (percent of drives that land in thefairway). Data on these two variables for the top 40 PGAgolfers are saved in the accompanying file. A professionalgolfer is practicing a new swing to increase his averagedriving distance. However, he is concerned that his drivingaccuracy will be lower. Is his concern a valid one? Explain.

Products “Made in the USA.”“Made in the USA” is a claim stated in many product advertisements or on product labels. Advertisers want consumers to believe that the product is manufactured with 100% U.S. labor and materials—which is often not the case. What does “Made in the USA” mean to the typical consumer? To answer this question, a group of marketing professors conducted an experiment at a shopping mall (Journal of Global Business, spring 2002). They asked every fourth adult entrant to the mall to participate in the study. A total of 106 shoppers agreed to answer the question, “‘Made in the USA’ means what percentage of U.S. labor and materials?” The responses of the 106 shoppers are summarized as follows: “100%” (64 shoppers), “75 to 99%” (20 shoppers), “50 to 74%” (18 shoppers), and “less than 50%” (4 shoppers).

a.What type of data-collection method was used?

b.What type of variable, quantitative or qualitative, is measured?

c.Present the data in graphical form. Use the graph to make a statement about the percentage of consumers who believe “Made in the USA” means 100% U.S. labor and materials.

See all solutions

Recommended explanations on Math Textbooks

View all explanations

What do you think about this solution?

We value your feedback to improve our textbook solutions.

Study anywhere. Anytime. Across all devices.

Sign-up for free