Least-squares idea The table below gives a small set of data. Which of the following two lines fits the data better: y^=1xory^=32x? Make a graph of the data and use it to help justify your answer. (Note: Neither of these two lines is the least-squares regression line for these data.)

Short Answer

Expert verified

The lineY=3-2fits the data better.

Step by step solution

01

Given Information

It is given in the question that,y^=1xory^=32x

02

Explanation

Below is the scatter plot for the data given,

By using a red line, the line Y=1-Xcan be seen and by using a green line, it can be seen that Y=3-2Xcan be seen.

The figure shows that lineY=1-Xfits better in a scatter plot since it passes through only two points and that the rest of the points follow this line closely.

The data is, therefore, better suited toY=3-2X.

Unlock Step-by-Step Solutions & Ace Your Exams!

  • Full Textbook Solutions

    Get detailed explanations and key concepts

  • Unlimited Al creation

    Al flashcards, explanations, exams and more...

  • Ads-free access

    To over 500 millions flashcards

  • Money-back guarantee

    We refund you if you fail your exam.

Over 30 million students worldwide already upgrade their learning with Vaia!

One App. One Place for Learning.

All the tools & learning materials you need for study success - in one app.

Get started for free

Most popular questions from this chapter

Predict the rat’s weight after16 weeks. Show your work

The scatterplots below show four sets of real data:

(a) repeats the manatee plot in Figures

(b) shows the number of named tropical storms and the number predicted before the start of hurricane season each year between 1984and 2007by William Gray of Colorado State University;

(c) plots the healing rate in micrometers (millionths of a meter) per hour for the two front limbs of several newts in an experiment; and

(d) shows stock market performance in consecutive years over a 56-year period.

The scatterplot in (b) contains an outlier: the disastrous 2005season, which had 27named storms, including Hurricane Katrina. What effect would remove this point have on the correlation? Explain.

(a)

(b)

(c)

(d)

Beer and blood alcohol The example on page 182describes a study in which adults drank different amounts of beer. The response variable was their blood alcohol content (BAC). BAC for the same amount of beer might depend on other facts about the subjects. Name two other variables that could account for the fact that r2=0.80.

Merlins breeding Exercise 13 (page 160) gives data on the number of breeding pairs of merlins in an isolated area in each of nine years and the percent of males who returned the next year. The data show that the percent returning is lower after successful breeding seasons and that the relationship is roughly linear. The figure below shows the Minitab regression output for these data.
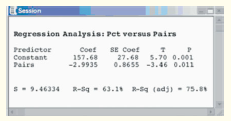
(a) What is the equation of the least-squares regression line for predicting the percent of males that

return from the number of breeding pairs? Use the equation to predict the percent of returning males after a season with 30 breeding pairs.

(b) What percent of the year-to-year variation in the percent of returning males is explained by the straight-line relationship with a number of breeding pairs the previous year?

(c) Use the information in the figure to find the correlation r between the percent of males that return and the number of breeding pairs. How do you know whether the sign of r is + or −?

(d) Interpret the value of s in this setting.

Strong association but no correlation The gas mileage of an automobile first increases and then decreases as the speed increases. Suppose that this relationship is very regular, as shown by the following data on speed (miles per hour) and mileage (miles per gallon). Make a scatterplot of mileage versus speed.

The correlation between speed and mileage isr=0. Explain why the correlation is 0 even though there is a strong relationship between speed and mileage.

See all solutions

Recommended explanations on Math Textbooks

View all explanations

What do you think about this solution?

We value your feedback to improve our textbook solutions.

Study anywhere. Anytime. Across all devices.

Sign-up for free