The National Survey of Adolescent Health interviewed several thousand teens (grades 7to 12). One question asked was “What do you think are the chances you will be married in the next ten years?” Here is a two-way table of the responses by gender:

What percent of females thought that they were almost certain to be married in the next ten years?

(a) About 16% (c) About 40% (e) About 61%

(b) About 24% (d) About 45%

Short Answer

Expert verified

The correct option is (d) About 45%

Step by step solution

01

Given information

The below table shows the responses by gender.

02

Concept

There is a real-world scenario for a statistical problem. The four processes of state, plan, do, and conclusions can be used to organize a variety of situations.

03

Calculation

According to the table above, about45percent of females will marry in the next ten years. As a result, option (d) about45%is correct.

Unlock Step-by-Step Solutions & Ace Your Exams!

  • Full Textbook Solutions

    Get detailed explanations and key concepts

  • Unlimited Al creation

    Al flashcards, explanations, exams and more...

  • Ads-free access

    To over 500 millions flashcards

  • Money-back guarantee

    We refund you if you fail your exam.

Over 30 million students worldwide already upgrade their learning with Vaia!

One App. One Place for Learning.

All the tools & learning materials you need for study success - in one app.

Get started for free

Most popular questions from this chapter

The National Survey of Adolescent Health interviewed several thousand teens (grades 7 to 12). One question asked was “What do you think are the chances you will be married in the next ten years?” Here is a two-way table of the responses by gender:

Your percent from the previous exercise is part of

(a) the marginal distribution of females.

(b) the marginal distribution of gender.

(c) the marginal distribution of opinion about marriage.

(d) the conditional distribution of gender among adolescents with a given opinion.

(e) the conditional distribution of opinion among adolescents of a given gender.

You are preparing to study the television-viewing habits of high school students. Describe two categorical variables and two quantitative variables that you might record for each student. Give the units of measurement for the quantitative variables.

The histogram below shows the distribution of the percent of women aged15 and over who have never married in each of the 50 states and the District of Columbia.


The leftmost bar in the histogram covers percent of never-married women ranging from about

(a)20%to24%.

(d) 0%to5%

(b) 20%to22%

(e) None of these.

(c) 0%

An experiment was conducted to investigate the effect of a new weed killer to prevent weed growth in onion crops. Two chemicals were used: the standard weed killer (C) and the new chemical (W). Both chemicals were tested at high and low concentrations on a total of 50 test plots. The percent of weeds that grew in each plot was recorded. Here are some boxplots of the results. Which of the following is not a correct statement about the results of this experiment?
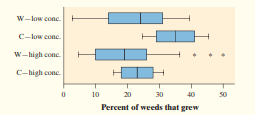
(a) At both high and low concentrations, the new chemical (W) gives better weed control than the standard weed killer (C).

(b) Fewer weeds grew at higher concentrations of both chemicals.

(c) The results for the standard weed killer are less variable than those for the new chemical.

(d) High and low concentrations of either chemical have approximately the same effects on weed growth.

(e) Some of the results for the low concentration of weed killer W show fewer weeds growing than some of the results for the high concentrate

How can we help wood surfaces resist weathering, especially when restoring historic wooden buildings? In a study of this question, researchers prepared wooden panels and then exposed them to the weather. Here are some of the variables recorded: type of wood (yellow poplar, pine, cedar); type of water repellent (solvent-based, water-based); paint thickness (millimeters); paint color (white, gray, light blue); weathering time (months).

Identify each variable as categorical or quantitative.

See all solutions

Recommended explanations on Math Textbooks

View all explanations

What do you think about this solution?

We value your feedback to improve our textbook solutions.

Study anywhere. Anytime. Across all devices.

Sign-up for free