Chapter 1: Q 3.3. (page 64)
The heights (in inches) of the five starters on a basketball team are
Show how to calculate the variance and standard deviation from the values in your table.
Short Answer
The sample variance is and standard deviation is
Chapter 1: Q 3.3. (page 64)
The heights (in inches) of the five starters on a basketball team are
Show how to calculate the variance and standard deviation from the values in your table.
The sample variance is and standard deviation is
All the tools & learning materials you need for study success - in one app.
Get started for free
Forty students took a statistics examination having a maximum of 50 points. The score distribution is given in the following stem-and-leaf plot:

The third quartile of the score distribution is equal to (a) 45. (b) 44. (c) 43. (d) 32. (e) 23.
The audience for movies Here are data on the percent of people in several age groups who attended a movie in the past months:
(a) Display these data in a bar graph. Describe what you see.
(b) Would it be correct to make a pie chart of these data? Why or why not?
(c) A movie studio wants to know what percent of the total audience for movies is to years old. Explain why these data do not answer this question.
| Age group | Movie attendence |
| 18 to 24 years | 83% |
| 25 to 34 years | 73% |
| 35 to 44 years | 68% |
| 45 to 54 years | 60% |
| 55 to 64 years | 47% |
| 65 to 74 years | 32% |
| 75 to and over | 20% |
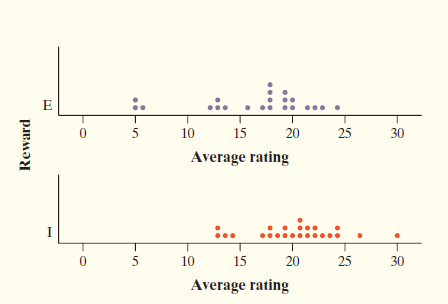
The chapter-opening Case Study described research by Teresa Amabile investigating whether external rewards would promote creativity in children’s artwork. Dr. Amabile conducted another study involving college students, who were divided into two groups using a chance process (like drawing names from a hat). The students in one group were given a list of statements about external reasons
(E) for writing, such as public recognition, making money, or pleasing their parents. Students in the other group were given a list of statements about internal reasons (I) for writing, such as expressing yourself and
enjoying playing with words. Both groups were then instructed to write a poem about laughter.
Each student’s poem was rated separately by different poets using a creativity scale. The poets’ ratings of each student’s poem were averaged to obtain an overall creativity score.
A dot-plot of the two groups’ creativity scores is shown below. Compare the two distributions. What do you conclude about whether external rewards promote creativity?

Do women study more than men? We asked the students in a large first-year college class how many minutes they studied on a typical weeknight. Here are
the responses of random samples of women and men from the class:

(a) Examine the data. Why are you not surprised that most responses are multiples of 10 minutes? Are there any responses you consider suspicious?
(b) Make a back-to-back stem plot to compare the two samples. Does it appear that women study more than men (or at least claim that they do)? Justify your answer.
If a distribution is skewed to the right with no outliers,
(a) mean median. (d) mean > median.
(b) mean median. (e) We can’t tell without examining the data.
(c) mean median.
What do you think about this solution?
We value your feedback to improve our textbook solutions.