Let’s continue our analysis of Joey’s sample of M&M’S Peanut Chocolate Candies from the previous Check Your Understanding (page 681).

23% each of blue and orange, 15% each of green and yellow, and 12% each of red and brown. Joey bought a bag of Peanut Chocolate Candies and counted the colors of the candies in his sample: 12 blue, 7 orange, 13 green, 4 yellow, 8 red, and 2 brown.

2. Sketch a graph like Figure 11.4 that shows the P-value.

Short Answer

Expert verified

The p-value can be visualized (area shaded in blue) as follows:

Step by step solution

01

Given

23% each of blue and orange, 15% each of green and yellow, and 12% each of red and brown. Joey bought a bag of Peanut Chocolate Candies and counted the colors of the candies in his sample: 12 blue, 7 orange, 13 green, 4 yellow, 8 red, and 2 brown.

02

Formulation

In order to calculate the p value we need to calculate the chi-square statistics.

The formula for chi-square statistics is:

𝓧2=iOi-Ei2Ei

Upon putting the value in above formula and simplifying we get,

𝓧2=11.1516

03

The p-value

The p-value is depicted in the following figure (shaded in light blue) as follows:

Unlock Step-by-Step Solutions & Ace Your Exams!

  • Full Textbook Solutions

    Get detailed explanations and key concepts

  • Unlimited Al creation

    Al flashcards, explanations, exams and more...

  • Ads-free access

    To over 500 millions flashcards

  • Money-back guarantee

    We refund you if you fail your exam.

Over 30 million students worldwide already upgrade their learning with Vaia!

One App. One Place for Learning.

All the tools & learning materials you need for study success - in one app.

Get started for free

Most popular questions from this chapter

In the United States, there is a strong relationship between education and smoking: well-educated people are less likely to smoke. Does a similar relationship hold in France? To find out, researchers recorded the level of education and smoking status of a random sample of 459 French men aged 20 to 60 years. 11 The two-way table below displays the data.

(a) Is the relationship between smoking status and educational level statistically significant? Give appropriate evidence to support your answer.

(b) Which cell in the table contributes most to the relationship in part (a)? Justify your answer.

A study conducted in Charlotte, North Carolina, tested the effectiveness of three police responses to spouse abuse: (1) advise and possibly separate the couple, (2) issue a citation to the offender, and (3) arrest the offender. Police officers were trained to recognize eligible cases. When presented with an eligible case, a police officer called the dispatcher, who would randomly assign one of the three available treatments to be administered. There were a total of 650 cases in the study. Each case was classified according to whether the abuser was subsequently arrested within six months of the original incident.
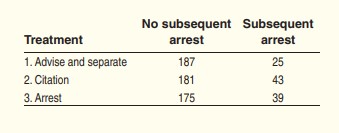
(a) Explain the purpose of the random assignment in the design of this study.

(b) Construct a well-labeled graph that is suitable for comparing the effectiveness of the three treatments.

(c) We want to use these data to perform a test ofH0:p1=p2=p3wherepi=

the true proportion of spouse abusers like the ones in this study who would be arrested again within six months after receiving treatment \(i\). State an appropriate alternative hypothesis.

(d) Assume that all the conditions for performing the test in part (b) are met. The test yields χ2=5.063and a P-value of 0.0796Interpret this P-value in context. What conclusion should we draw from the study?

Which hypotheses would be appropriate for performing a chi-square test?

(a) The null hypothesis is that the closer students get to graduation, the less likely they are to be opposed to tuition increases. The alternative is that how close students are to graduation makes no difference in their opinion.

(b) The null hypothesis is that the mean number of students who are strongly opposed is the same for each of the four years. The alternative is that the mean is different for at least two of the four years.

(c) The null hypothesis is that the distribution of student opinion about the proposed tuition increase is the same for each of the four years at this university. The alternative is that the distribution is different for at least two of the four years.

(d) The null hypothesis is that year in school and student opinion about the tuition increase in the sample are independent. The alternative is that these variables are dependent.

(e) The null hypothesis is that there is an association between a year in school and opinion about the tuition increase at this university. The alternative hypothesis is that these variables are not associated.

Some people think recycled products are lower in quality than other products, a fact that makes recycling less practical. Here are data on attitudes toward coffee filters made of recycled paper from a random sample of adults:

(a) Make a bar graph that compares buyers’ and non-buyers’ opinions about recycled filters. Describe what you see

(b) Minitab output for a chi-square test using these data is shown below. Carry out the test. What conclusion do you draw?

A study of identity theft looked at how well consumers protect themselves from this increasingly prevalent crime. The behaviors of 61randomly selected college students were compared with the behaviors of 59randomly selected non students.39One of the questions was “When asked to create a password, I have used either my mother’s maiden name, or my pet’s name, or my birth date,

or the last four digits of my social security number, or a series of consecutive numbers.” For the students, 22agreed with this statement while 30of the nonstudents agreed.

a) Display the data in a two-way table and perform

the appropriate chi-square test. Summarize the results.

(b) Reanalyze the data using the methods for comparing two proportions that we studied in Chapter10. Compare the results and verify that the chi-square

statistic is the square of the z statistic.

See all solutions

Recommended explanations on Math Textbooks

View all explanations

What do you think about this solution?

We value your feedback to improve our textbook solutions.

Study anywhere. Anytime. Across all devices.

Sign-up for free