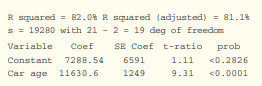
Prey attracts predators Refer to Exercise 3. Computer output from the least-squares regression analysis on the perch data is shown below.

The model for regression inference has three parameters: α,βand σ. Explain what each parameter represents in context. Then provide an estimate for each.

Short Answer

Expert verified

Three parameters of the regression inference model were found to be:

α=0.12049

β=0.008569

σ=0.1886

Step by step solution

01

Given Information

Computer output from the least-squares regression analysis on the perch data is shown below.

02

Explanation

The y-intercept, or estimate of the fraction of fish killed when the tank contains no fish, is α. The estimate of αis given in the "Coef" column and the "Constant" row:

α=0.12049.

The slope is defined as the predicted proportion of fish destroyed per fish in the tank. The estimate of βis given in the "Coef" column and the "Perch" row:

β=0.008569.

The fraction of fish killed around the population regression line has a standard deviation of σ.

σ=0.1886

Unlock Step-by-Step Solutions & Ace Your Exams!

  • Full Textbook Solutions

    Get detailed explanations and key concepts

  • Unlimited Al creation

    Al flashcards, explanations, exams and more...

  • Ads-free access

    To over 500 millions flashcards

  • Money-back guarantee

    We refund you if you fail your exam.

Over 30 million students worldwide already upgrade their learning with Vaia!

One App. One Place for Learning.

All the tools & learning materials you need for study success - in one app.

Get started for free

Most popular questions from this chapter

Stats teachers' cars A random sample of AP Statistics teachers were asked to report the age (in years) and mileage of their primary vehicles. A scatterplot of the data is shown below.

Computer output from a least-squares regression analysis of these data is shown below. Assume that the conditions for regression inference are met.

(a) Verify that the 95% confidence interval for the slope of the population regression line is (9016.4, 14,244.8 ).

(b) A national automotive group claims that the typical driver puts 15,000 miles per year on his or her main vehicle. We want to test whether AP Statistics teachers are typical drivers. Explain why an appropriate pair of hypotheses for this test is H0:β=15,000versus Ha:β15,000.

(c) What conclusion would you draw for this significance test based on your interval in part (a)? Justify your answer.

A distribution of exam scores has mean 60and standard deviation 18. If each score is doubled, and then 5is subtracted from that result, what will be the mean and standard deviation, respectively, of the new scores?

(a) mean=115and standard deviation=31

(b) mean=115and standard deviation=36

(c) mean=120and standard deviation=6

(d) mean=120and standard deviation=31

(e) mean=120 and standard deviation=36

Color words (9.3) Explain why it is not safe to use paired t procedures to do inference about the difference in the mean time to complete the two tasks.

Explain why it would be reasonable to use an exponential model to describe the relationship between the U.S. population in the years 1790 to 1880 and the number of years since 1700. Here is some Minitab output from a linear regression analysis on the transformed data.

Oil and residuals Exercise 59 on page 193 (Chapter 3) examined data on the depth of small defects in the Trans-Alaska Oil Pipeline. Researchers compared the results of measurements on 100 defects made in the field with measurements of the same defects made in the laboratory. The figure below shows a residual plot for the least-squares regression line based on these data. Are the conditions for performing inference about the slopeβ of the population regression line met? Justify your answer.

See all solutions

Recommended explanations on Math Textbooks

View all explanations

What do you think about this solution?

We value your feedback to improve our textbook solutions.

Study anywhere. Anytime. Across all devices.

Sign-up for free