An experiment was conducted to determine the effect of practice time (in seconds) on the percent of unfamiliar words recalled. Here is a Fathom scatterplot of the results with a least-squares regression line superimposed.

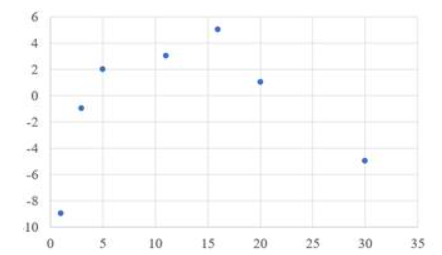
(a) Sketch a residual plot. Be sure to label your axes.

(b) Explain why a linear model is not appropriate for describing the relationship between practice time and the percent of words recalled.

(c) We used Fathom to transform the data in hopes of achieving linearity. The screenshots below show the results of two different transformations. Would an exponential model or a power model describe the relationship better? Justify your answer.

(d) Use the model you chose in part (c) to predict word recall for 25seconds of practice. Show your method.

Short Answer

Expert verified

(a)

(b) A linear model is not appropriate for describing the relationship between practice time and the percent of words recalled because the residual plot has a clear pattern.

(c) A power model describes the relationship better.

(d) The word recalled for 25seconds of practice isy=83.3568.

Step by step solution

01

Part(a) Step 1: Given Information

02

Part(a) Step 2: Explanation

The residual is negative if the point falls below the blue regression line. If a point is well above the blue regression line, it has a positive value. The actual figure of the residual is the vertical distance between it and the blue line. The time values are on the horizontal axis, and the remainder are on the vertical axis, in the residual plot. A possible residual plot shown above.

03

Part(b) Step 1: Given Information

04

Part(b) Step 2: Explanation

Because the scatter plot has a curvature and the residual plot has an obvious pattern, it is clear that a linear model is not appropriate.

05

Part(c) Step 1: Given Information

06

Part(c) Step 2: Explanation

The top scatterplot plot represents a power model (both variables are present), while the bottom scatterplot figure represents an exponential model. The scatterplot shows that the model that best describes the relationship has by far the most linear pattern.

07

Part(d) Step 1: Given Information

08

Part(d) Step 2: Explanation

For the top scatterplot, the regression equation is:

lny=3.48+0.293lnx

Where xrepresents time andy represents a recollection.

Replacing the value of xwith x=25

lny=3.48+0.293lnx=3.48+0.293ln(25)=4.42313

Taking the exponential

y=e4.42313=83.3568

Unlock Step-by-Step Solutions & Ace Your Exams!

  • Full Textbook Solutions

    Get detailed explanations and key concepts

  • Unlimited Al creation

    Al flashcards, explanations, exams and more...

  • Ads-free access

    To over 500 millions flashcards

  • Money-back guarantee

    We refund you if you fail your exam.

Over 30 million students worldwide already upgrade their learning with Vaia!

One App. One Place for Learning.

All the tools & learning materials you need for study success - in one app.

Get started for free

Most popular questions from this chapter

Color words (9.3) Explain why it is not safe to use paired t procedures to do inference about the difference in the mean time to complete the two tasks.

Below are boxplots of SAT Critical Reading and Math scores for a randomly selected group of female juniors at a highly competitive suburban school.

Which of the following cannot be justified by the plots shown above?

(a) The maximum Critical Reading score is higher than the maximum Math score.

(b) Critical Reading scores are skewed to the right, whereas Math scores are somewhat skewed to the left.

(c) The median Critical Reading score for females is slightly higher than the median Math score.

(d) There appear to be no outliers in the SAT score distributions.

(e) The mean Critical Reading score and the mean Math score for females are about the same.

Prey attracts predators Here is one way in which nature regulates the size of animal populations: high population density attracts predators, which remove a higher proportion of the population than when the density of the prey is low. One study looked at kelp perch and their common predator, the kelp bass. The researcher set up four large circular pens on sandy ocean bottoms off the coast of southern California. He chose young perch at random from a large group and placed 10,20,40 and60 perch in the four pens. Then he dropped the nets protecting the pens, allowing the bass to swarm in, and counted the perch left after two hours. Here are data on the proportions of perch eaten in four repetitions of this setup .

The explanatory variable is the number of perch (the prey) in a confined area. The response variable is the proportion of perch killed by bass (the predator) in two hours when the bass are allowed access to the perch. A scatterplot of the data shows a linear relationship.

We used Minitab software to carry out a least-squares regression analysis for these data. A residual plot and a histogram of the residuals are shown below. Check whether the conditions for performing inference about the regression model are met.

A city wants to conduct a poll of taxpayers to determine the level of support for constructing a new city-owned baseball stadium. Which of the following is the primary reason for using a large sample size in constructing a confidence interval to estimate the proportion of city taxpayers who would support such a project?

(a) To increase the confidence level

(b) To eliminate any confounding variables

(c) To reduce nonresponse bias

(d) To increase the precision of the estimate

(e) To reduce under coverage

Marcella takes a shower every morning when she gets up. Her time in the shower varies according to a Normal distribution with mean 4.5minutes and standard deviation 0.9minutes.

(a) If Marcella took a 7-minute shower, would it be classified as an outlier? Justify your answer.

(b) Suppose we choose 10days at random and record the length of Marcella’s shower each day. What’s the probability that her shower time is 7minutes or higher on at least 2of the days? Show your work.

(c) Find the probability that the mean length of her shower times on these 10 days exceeds5 minutes. Show your work

See all solutions

Recommended explanations on Math Textbooks

View all explanations

What do you think about this solution?

We value your feedback to improve our textbook solutions.

Study anywhere. Anytime. Across all devices.

Sign-up for free