Cold cabin? The Fathom screenshot below shows the results of taking 500SRSs of 10temperature readings from a population distribution that’s N(50,3)and recording the sample minimum each time.

(a) Describe the approximate sampling distribution.

(b) Suppose that the minimum of an actual sample is 40°F. What would you conclude about the thermostat manufacturer’s claim? Explain.

Short Answer

Expert verified

a). The sampling distribution is roughly symmetric.

b). The claim appears to be false.

Step by step solution

01

Part (a) Step 1: Given Information

The Fathom screenshot below shows the results of taking 500 SRSs of 10 temperature.

02

Part (a) Step 2: Explanation 

The sample distribution is roughly symmetric. Because the dot plot contains the largest columns of dots roughly in the middle

Because the Centre of a symmetric distribution is roughly at the highest point of the graph, the sampling distribution is centered at around45°F,

The range of values is from roughly 39°Fto 50°F.

03

Part (b) Step 1: Given Information 

The Fathom screenshot below shows the results of taking 500 SRSs of 10 temperature

04

Part (b) Step 2: Explanation 

If the manufacturer's claim is correct, the dot plot will show the approximate sampling distribution.

We can see that there are no dots above 40and only 1 dot to its left, implying that obtaining a sample minimum of 40is extremely unlikely, and hence the manufacturer's claim appears to be untrue.

Unlock Step-by-Step Solutions & Ace Your Exams!

  • Full Textbook Solutions

    Get detailed explanations and key concepts

  • Unlimited Al creation

    Al flashcards, explanations, exams and more...

  • Ads-free access

    To over 500 millions flashcards

  • Money-back guarantee

    We refund you if you fail your exam.

Over 30 million students worldwide already upgrade their learning with Vaia!

One App. One Place for Learning.

All the tools & learning materials you need for study success - in one app.

Get started for free

Most popular questions from this chapter

T7.11. Below are histograms of the values taken by three sample statistics in several hundred samples from the same population. The true value of the population parameter is marked with an arrow on each histogram

Which statistic would provide the best estimate of the parameter? Justify your answer

According to the U.S. census, the proportion of adults in a certain county who owned their own home was 0.71. An SRS of 100adults in a certain section of the county found that65 owned their home. Which one
of the following represents the approximate probability of obtaining a sample of 100adults in which fewer than 65own their home, assuming that this section of the county has the same overall proportion of adults who own their home as does the entire county?

(a) 10065(0.71)65(0.29)35

(b) 10065(0.29)65(0.71)35
(c) Pz<0.65-0.71(0.71)(0.29)100

(d) Pz<0.65-0.71(0.65)(0.35)100
(e) Pz<0.65-0.71(0.71)(0.29)100

The probability distribution for the number of heads in four tosses of a coin is given by

Number of heads01234
Probability0.0625
0.2500
0.3750
0.2500
0.0625

The probability of getting at least one tail in four tosses of a coin is

(a) 0.2500. (b)0.3125(c) 0.6875(d)0.9375 (d) None of these

1) State whether it is a parameter or a statistic and (2)use appropriate notation to describe each

number; for example, p = 0.65.

Get your bearings A large container of ball bearings has mean diameter 2.5003 centimeters (cm). This is within the specifications for acceptance of the container by the purchaser. By chance, an inspector chooses 100 bearings from the container that have a mean diameter of 2.5009 cm. Because this is outside the

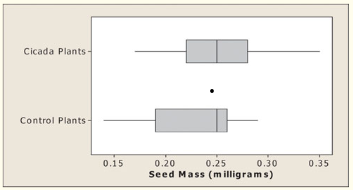
AP2.24. Every 17years, swarms of cicadas emerge from the ground in the eastern United States, live for about six weeks, and then die. (There are several different “broods,” so we experience cicada eruptions more often than every 17years.) There are so many cicadas that their dead bodies can serve as fertilizer and increase plant growth. In a study, a researcher added 10cicadas under 39randomly selected plants in a natural plot of American bell flowers on the forest floor, leaving other plants undisturbed. One of the response variables measured was the size of seeds produced by the plants. Here are the box plots and summary statistics of seed mass (in milligrams) for 39cicada plants and 33undisturbed (control) plants:

Variable: n Minimum Q1 Median Q3 Maximum

Cicada plants: 39 0.17 0.22 0.25 0.28 0.35
Control plants: 33 0.14 0.19 0.25 0.26 0.29
(a) Is this an observational study or an experiment? Explain.
(b) Based on the graphical displays, which distribution has
the larger mean? Justify your answer.
(c) Do the data support the idea that dead cicadas can
serve as fertilizer? Give graphical and numerical evidence
to support your conclusion.

See all solutions

Recommended explanations on Math Textbooks

View all explanations

What do you think about this solution?

We value your feedback to improve our textbook solutions.

Study anywhere. Anytime. Across all devices.

Sign-up for free