What does the CLT say? Asked what the central limit theorem says, a student replies, "As you take larger and larger samples from a population, the histogram of the sample values looks mote and more Normal." ls the student right? Explain your answer.

Short Answer

Expert verified

The student is not right

Step by step solution

01

Step-1 Given Information

Given in the question that

The statement of the student=As you take larger larger samples from a population, the histogram of the sample values looks mote and more Normal.we have to find that ls the student right.

02

Step-2 Explanation

The central limit theorem asserts that if a population has a mean μand standard deviation σand large random samples with replacement are selected from the population, the sample means distribution will be approximately normal.

The student's argument is incorrect because as the sample size grows, the histogram of the sample values will take on the shape of the population distribution.

As a result, the student is incorrect.

Unlock Step-by-Step Solutions & Ace Your Exams!

  • Full Textbook Solutions

    Get detailed explanations and key concepts

  • Unlimited Al creation

    Al flashcards, explanations, exams and more...

  • Ads-free access

    To over 500 millions flashcards

  • Money-back guarantee

    We refund you if you fail your exam.

Over 30 million students worldwide already upgrade their learning with Vaia!

One App. One Place for Learning.

All the tools & learning materials you need for study success - in one app.

Get started for free

Most popular questions from this chapter

Tall girls According to the National Center for Health Statistics, the distribution of heights for 16-year-old females is modeled well by a Normal density curve with mean μ=64inches and standard deviation σ=2.5inches. To see if this distribution applies at their high school, an AP Statistics class takes an SRS of 20of the 30016-year-old females at the school and measures their heights. What values of the sample mean x would be consistent with the population distribution being N(64,2.5)? To find out, we used Fathom software to simulate choosing 250SRSs of size n=20students from a population that is N(64,2.5). The figure below is a dotplot of the sample mean height x of the students in the sample.
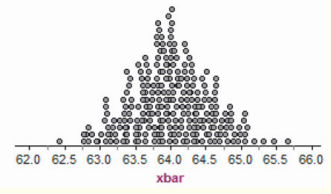
(a) Is this the sampling distribution of x? Justify your answer.

(b) Describe the distribution. Are there any obvious outliers?

(c) Suppose that the average height of the 20girls in the class’s actual sample is x=64.7. What would you conclude about the population mean height Mfor the 16-year-old females at the school? Explain.

Tall girls Refer to Exercise 10.

(a) Make a graph of the population distribution.

(b) Sketch a possible graph of the distribution of sample data for the SRS of size 20 taken by the AP Statistics class.

Run a mile During World War II, able-bodied male undergraduates at the University of Illinois participated in required physical training. Each student ran a timed mile. Their times followed the Normal distribution with mean 7.11minutes and standard deviation 0.74minute. An SRS of 100of these students has mean time x¯=7.15minutes. A second SRS of size100has mean x¯=6.97minutes. After many SRSs, the values of the sample mean x follow the Normal distribution with mean 7.11 minutes and standard deviation0.074minute.

(a) What is the population? Describe the population distribution. (b) Describe the sampling distribution of x. How is it different from the population distribution?

The candy machine Suppose a large candy machine has 15%orange candies. Use Figure 7.13 (page 435) to help answer the following questions.

(a) Would you be surprised if a sample of 25 candies from the machine contained 8 orange candies (that's 32%orange)? How about 5 orange candies ( 20%orange)? Explain.

(b) Which is more surprising: getting a sample of 25 candies in which 32%are orange or getting a sample of 50 candies in which 32% are orange? Explain.

Airline passengers get heavier In response to the increasing weight of airline passengers, the Federal Aviation Administration (FAA) in 2003told airlines to assume that passengers average 190pounds in the summer, including clothes and carry-on baggage. But passengers vary, and the FAA did not specify a standard deviation. A reasonable standard deviation is 35pounds. Weights are not Normally distributed, especially when the population includes both men and women, but they are not very non-Normal. A commuter plane carries 30passengers.

(a) Explain why you cannot calculate the probability that a randomly selected passenger weighs more than 200pounds.

(b) Find the probability that the total weight of the passengers on a full flight exceeds 6000pounds. Show your work. (Hint: To apply the central limit theorem, restate the problem in terms of the mean weight.)

See all solutions

Recommended explanations on Math Textbooks

View all explanations

What do you think about this solution?

We value your feedback to improve our textbook solutions.

Study anywhere. Anytime. Across all devices.

Sign-up for free