Here are the weights (in milligrams) of 58 diamonds from a nodule

carried up to the earth’s surface in surrounding rock. These data represent a population of diamonds formed in a single event deep in the earth.

Make a histogram to display the distribution of weight. Describe the distribution.

Short Answer

Expert verified

The distribution is skewed to right, spread from 0 to 35 with center at 2.5 and without outliers.

Step by step solution

01

Given information

Data illustrating the population of diamonds generated in a single deep-earth event:

02

Calculation

Frequency table:

Calculate the frequency of each interval, which is the number of data values that fall within it.

The first value of the first interval is 0 having a width of 5

Thus,

The first interval is 0<5

The interval follows

5<10,10<15 etc.

The intervals will be established until all of the data values are assigned to exactly one interval.

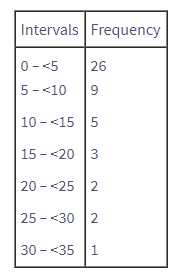
Frequency Histogram:

Interval bounds must be used to define the bars, and each bar's width must be the same.

Whereas, the height needs to be equal to the frequency.

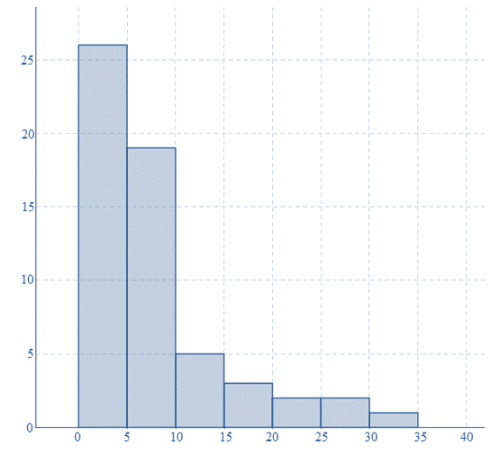
Spread: In the data set, the weight appears to range from 0.1 to 33.8 and in the histogram, it appears to range from 0 to 35

Shape: The highest bars are on the left of the histogram, with a tail of smaller balls to the right. As a result, the shape will be slanted toward the right.

Outliers: There are no outliers because the histogram has no gaps.

Because it is in the middle of the highest bar, the distribution's center looks to be around 2.5

Unlock Step-by-Step Solutions & Ace Your Exams!

  • Full Textbook Solutions

    Get detailed explanations and key concepts

  • Unlimited Al creation

    Al flashcards, explanations, exams and more...

  • Ads-free access

    To over 500 millions flashcards

  • Money-back guarantee

    We refund you if you fail your exam.

Over 30 million students worldwide already upgrade their learning with Vaia!

One App. One Place for Learning.

All the tools & learning materials you need for study success - in one app.

Get started for free

Most popular questions from this chapter

More crying? Refer to Exercise 16Does the fact that r=0.45 suggest that making an infant cry will increase his or her IQ later in life? Explain your reasoning.

More Olympic athletes In Exercises 5 and 11, you described the relationship between height (in inches) and weight (in pounds) for Olympic track and field athletes. The scatterplot shows this relationship, along with two regression lines. The regression line for the shotput, hammer throw, and discus throw athletes (blue squares) is y^=−115+5.13x. The regression line for the remaining athletes (black dots) is y^=−297+6.41x

a. How do the regression lines compare?

b. How much more do you expect a 72-inch discus thrower to weigh than a 72-inch sprinter?

Oh, that smarts! Infants who cry easily may be more easily stimulated than others. This may be a sign of a higher IQ. Child development researchers explored the relationship between the crying of infants 4 to 10 days old and their IQ test scores at age 3 years. A snap of a rubber band on the sole of the foot caused the infants to cry. The researchers recorded the crying and measured its intensity by the number of peaks in the most active 20 seconds. The correlation for these data is r=0.45.16 Interpret the correlation.

In a scatterplot of the average price of a barrel of oil and the average retail price of a gallon of gas, you expect to see

a. very little association.

b. a weak negative association.

c. a strong negative association.

d. a weak positive association.

e. a strong positive association.

Does fast driving waste fuel? How does the fuel consumption of a car change as its speed increases? Here are data for a British Ford Escort. Speed is measured in kilometers per hour and fuel consumption is measured in liters of gasoline used per 100 kilometers traveled.

a. Make a scatterplot to display the relationship between speed and fuel consumption.

b. Describe the relationship between speed and fuel consumption.

See all solutions

Recommended explanations on Math Textbooks

View all explanations

What do you think about this solution?

We value your feedback to improve our textbook solutions.

Study anywhere. Anytime. Across all devices.

Sign-up for free