Less gas? Refer to Exercise 38.

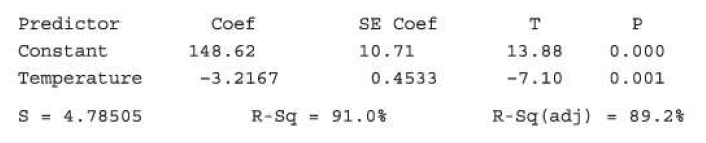
a. Interpret the slope of the regression line.

b. Does the value of the y intercept have meaning in this context? If so, interpret the y intercept. If not, explain why.

Short Answer

Expert verified

Part (a) The average amount of natural gas Joan will consume per day over the course of a month reduces by 19.87cubic feet per degree Fahrenheit.

Part (b) It does not have meaning.

Step by step solution

01

Part (a) Step 1: Given information

It is stated in the regression line question that,

y=142519.87x

02

Part (a) Step 2: Explanation

As we know, the slope in the least square regression equation is the coefficient of x and indicates the average rise or decrease of y per unit of x Thus, the slope is,

b1=19.87

As a result, the average amount of natural gas Joan will consume per day over the course of a month reduces by 19.87 cubic feet per degree Fahrenheit.

03

Part (b) Step 1: Explanation

The y-intercept, as we all know, is a constant in the least square regression equation that reflects the average y-value when x is 0 As a result, the y-intercept is:

b0=1425

When the temperature is 0 degrees Fahrenheit, this means that the average amount of natural gas utilized per day is 1425 cubic feet. The y-intercept has meaning in this instance because a temperature of 0 degrees Fahrenheit is feasible.

Unlock Step-by-Step Solutions & Ace Your Exams!

  • Full Textbook Solutions

    Get detailed explanations and key concepts

  • Unlimited Al creation

    Al flashcards, explanations, exams and more...

  • Ads-free access

    To over 500 millions flashcards

  • Money-back guarantee

    We refund you if you fail your exam.

Over 30 million students worldwide already upgrade their learning with Vaia!

One App. One Place for Learning.

All the tools & learning materials you need for study success - in one app.

Get started for free

Most popular questions from this chapter

Putting success How well do professional golfers putt from various distances to the hole? The data show various distances to the hole (in feet) and the percent of putts made at each distance for a sample of golfers.9 Make a scatterplot by hand that shows how the percent of putts made relates to the distance of the putt.

Calculating achievement a study found a strong link between the number of calculators possessed by high school pupils and their arithmetic proficiency, according to the principle of a high school. Based on this study, he decides to buy each student at his school two calculators, hoping to improve their math achievement. Explain the flaw in the principal’s reasoning.

Teenagers and corn yield Identify the explanatory variable and the response variable for the following relationships, if possible. Explain your reasoning.

a. The height and arm span of a sample of 50 teenagers.

b. The yield of corn in bushels per acre and the amount of rain in the growing season.

What’s my grade? In Professor Friedman’s economics course, the correlation

between the students’ total scores prior to the final examination and their final exam scores is r = 0.6. The pre-exam totals for all students in the course have a mean of 280 and a standard deviation of 30. The final exam scores have a mean of 75 and a standard deviation of 8. Professor Friedman has lost Julie’s final exam but knows that her total before the exam was 300. He decides to predict her final exam score from her pre-exam total.

a. Find the equation for the least-squares regression line Professor Friedman should use to make this prediction.

b. Use the least-squares regression line to predict Julie’s final exam score.

c. Explain the meaning of the phrase “least squares” in the context of this question.

d. Julie doesn’t think this method accurately predicts how well she did on the final exam. Determine r2. Use this result to argue that her actual score could have been much higher (or much lower) than the predicted value.

Scientists examined the activity level of 7 fish at different temperatures. Fish activity was rated on a scale of 0 (no activity) to 100 (maximal activity). The temperature was measured in degrees Celsius. A computer regression printout and a residual plot are provided. Notice that the horizontal axis on the residual plot is labeled “Fitted value,” which means the same thing as “predicted value.”

Which of the following gives a correct interpretation of s in this setting?

a. For every 1°C increase in temperature, fish activity is predicted to increase by 4.785 units.

b. The typical distance of the temperature readings from their mean is about 4.785°C.

c. The typical distance of the activity level ratings from the least-squares line is about 4.785 units.

d. The typical distance of the activity level readings from their mean is about 4.785 units.

e. At a temperature of 0°C, this model predicts an activity level of 4.785 units.

See all solutions

Recommended explanations on Math Textbooks

View all explanations

What do you think about this solution?

We value your feedback to improve our textbook solutions.

Study anywhere. Anytime. Across all devices.

Sign-up for free