More long jumps Refer to Exercise 52. Use technology to create a residual plot. Sketch the residual plot and explain what information it provides.

Short Answer

Expert verified

The pattern does not appear to include considerable curvature, implying that the linear model is adequate.

Step by step solution

01

Given information

02

Explanation

Now we must plot the dash time in seconds and the long-jump distance in inches on a residual plot. To make it, we'll utilize a calculator, such as a Ti83/84-calculator. To get to plot 1start by pressing 2nd>Y=and then entering. Then make sure that On is selected and that the first graph type is chosen. L1comes after Xlistand RESID comes after YlistAs a result of pressing GRAPH at the end, we get the following:

This suggests that the point pattern looks to be random in the scatterplot and that the pattern does not appear to include considerable curvature, implying that the linear model is adequate.

Unlock Step-by-Step Solutions & Ace Your Exams!

  • Full Textbook Solutions

    Get detailed explanations and key concepts

  • Unlimited Al creation

    Al flashcards, explanations, exams and more...

  • Ads-free access

    To over 500 millions flashcards

  • Money-back guarantee

    We refund you if you fail your exam.

Over 30 million students worldwide already upgrade their learning with Vaia!

One App. One Place for Learning.

All the tools & learning materials you need for study success - in one app.

Get started for free

Most popular questions from this chapter

The stock market Some people think that the behavior of the stock market in January predicts its behavior for the rest of the year. Take the explanatory variable xto be the percent change in a stock market index in January and the response variable yto be the change in the index for the entire year. We expect a positive correlation between xand y because the change during January contributes to the full year’s change. Calculation from data for an 18-year period gives

x¯=1.75%sz=5.36%y¯=9.07%sy=15.35%r=0.596

(a) What percent of the observed variation in yearly changes in the index is explained by a straight-line relationship with the change during January?

(b) For these data, s=8.3Explain what this value means

Penguins diving A study of king penguins looked for a relationship between how deep the penguins dive to seek food and how long they stay underwater.41 For all but the shallowest dives, there is an association between x = depth (in meters) and y = dive duration (in minutes) that is different for each penguin. The study gives a scatterplot for one penguin titled “The Relation of Dive Duration (y) to Depth (x).” The scatterplot shows an association that is positive, linear, and strong.

a. Explain the meaning of the term positive association in this context.

b. Explain the meaning of the term linear association in this context.

c. Explain the meaning of the term strong association in this context.

d. Suppose the researchers reversed the variables, using x = dive duration and y = depth.

A carpenter sells handmade wooden benches at a craft fair every week. Over the past year, the carpenter has varied the price of the benches from \(80

to \)120 and recorded the average weekly profit he made at each selling price. The prices of the bench and the corresponding average profits are shown in the table.

a. Make a scatterplot to show the relationship between price and profit.

b. The correlation for these data is r=0Explain how this can be true even though there is a strong relationship between price and average profit.

Stats teachers’ cars A random sample of AP® Statistics teachers were asked to

report the age (in years) and mileage of their primary vehicles. Here are a scatterplot, a residual plot, and other computer output:
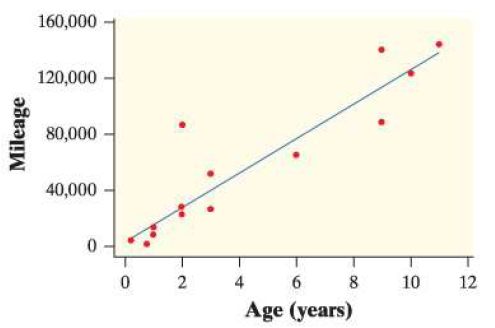
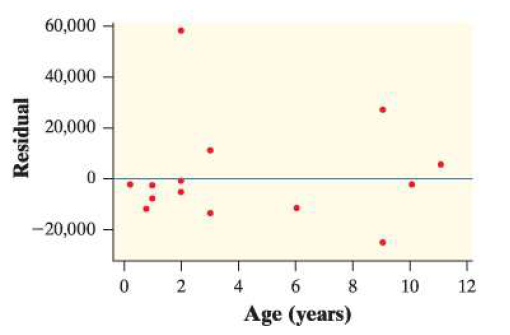
a. Is a linear model appropriate for these data? Explain how you know this.

b. What’s the correlation between car age and mileage? Interpret this value in context.

c. Give the equation of the least-squares regression line for these data. Identify any variables you use.

d. One teacher reported that her 6-year-old car had 65,000 miles on it. Find and interpret its residual.

e. Interpret the values of s and r2.

IQ and grades Exercise 3 (page 158) included the plot shown below of school grade point average (GPA) against IQ test score for 78seventh-grade students. (GPA was recorded on a 12-point scale with A+=12,A=11,A-=10,B+=9,...D-=1,F=0.) Calculation shows that the mean and standard deviation of the IQ scores areX¯=108.9and Sx=13.17For the GPAs, these values are Y=7.447andSy=2.10. The correlation between IQ and GPA is 0.6337

(a) Find the equation of the least-squares line for predicting GPA from IQ. Show your work.

(b) What percent of the observed variation in these students’ GPAs can be explained by the linear relationship between GPA and IQ?

(c) One student has an IQ of 103but a very low GPA of 0.53. Find and interpret the residual for this student

See all solutions

Recommended explanations on Math Textbooks

View all explanations

What do you think about this solution?

We value your feedback to improve our textbook solutions.

Study anywhere. Anytime. Across all devices.

Sign-up for free