More heavy backpacks Refer to your graph from Exercise 3 Describe the relationship between body weight and backpack weight for this group of hikers.

Short Answer

Expert verified

Linear, positive, and moderately strong association with one outlier.

Step by step solution

01

Given information

For scatterplot:

On horizontal axis: Bodyweight

On vertical axis: Backpack weight

02

Explanation

Strength: The spots in the scatterplot aren't too close together and aren't too far apart either. As a result, strength will be moderate.

Form: There is no substantial curvature in the scatterplot. As a result, the shape will be linear.

Direction: The pattern's upward slope means the direction will be positive.

Unusual features: The rightmost point in the scatterplot appears to vary greatly from the general linear trend seen in the other points. As a result, there is one outlier.

Unlock Step-by-Step Solutions & Ace Your Exams!

  • Full Textbook Solutions

    Get detailed explanations and key concepts

  • Unlimited Al creation

    Al flashcards, explanations, exams and more...

  • Ads-free access

    To over 500 millions flashcards

  • Money-back guarantee

    We refund you if you fail your exam.

Over 30 million students worldwide already upgrade their learning with Vaia!

One App. One Place for Learning.

All the tools & learning materials you need for study success - in one app.

Get started for free

Most popular questions from this chapter

A student wonders if tall women tend to date taller men than do short

women. She measures herself, her dormitory roommate, and the women in the adjoining dorm rooms. Then she measures the next man each woman dates. Here are the data (heights in inches):

a. Make a scatterplot of these data. Describe what you see.

b. Find the correlation r step by step, using the formula on page 166. Explain how your value for r matches your description in part (a).

More wins? Refer to Exercise 37

a. Interpret the slope of the regression line.

b. Does the value of the y-intercept have meaning in this context? If so, interpret the y-intercept. If not, explain why.

Rushing for points What is the relationship between rushing yards and points scored in the National Football League? The table gives the number of rushing yards and the number of points scored for each of the 16 games played by the Jacksonville Jaguars in a recent season.
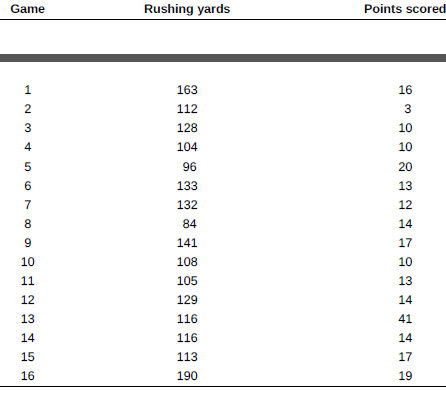
a. Make a scatterplot with rushing yards as the explanatory variable. Describe what you see.

b. The number of rushing yards in Game 16 is an outlier in the x-direction. What effect do you think this game has on the correlation? On the equation of the least-squares regression line? Calculate the correlation and equation of the least-squares regression line with and without this game to confirm your answers.

c. The number of points scored in Game 13 is an outlier in the y-direction. What effect do you think this game has on the correlation? On the equation of the least-squares regression line? Calculate the correlation and equation of the least-squares regression line with and without this game to confirm your answers.

Residual gas Refer to Exercise 38. During March, the average temperature was 46.4°F and Joan used an average of 490 cubic feet of gas per day. Calculate and interpret the residual for this month.

You have data for many years on the average price of a barrel of oil and the average retail price of a gallon of unleaded regular gasoline. If you want to see how well the price of oil predicts the price of gas, then you should make a scatterplot with ___________ as the explanatory variable.

a. the price of oil

b. the price of gas

c. the year

d. either oil price or gas price

e. time

See all solutions

Recommended explanations on Math Textbooks

View all explanations

What do you think about this solution?

We value your feedback to improve our textbook solutions.

Study anywhere. Anytime. Across all devices.

Sign-up for free