Potato chips Refer to Exercise 47 Use the 689599.7 rule to answer the

following questions.

a. About what percent of bags weigh less than 9.02 ounces? Show your method clearly.

b. A bag that weighs9.07 ounces is at about what percentile in this distribution? Justify your answer.

Short Answer

Expert verified

Part (a) 2.5% of the bags weigh less than 9.02 ounces.

Part (b) The bag is at 16th percentile.

Step by step solution

01

Part (a) Step 1: Given information

Mean,μ=9.12

Standard deviation,σ=0.05

02

Part (a) Step 2: Concept

Graph of normal probability- We can claim that the distribution is roughly Normal if the Normal probability plot has a linear structure.

03

Part (a) Step 3: Calculation
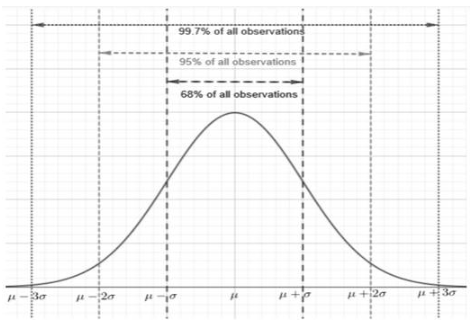
According to 689599.7 rule:

In a normal distribution, 68 percent of the data lies within 1 standard deviation of the mean.

A normal distribution has 95 percent of its data within two standard deviations of the mean.

A normal distribution has 99.7% of its data inside 1 standard deviation of the mean.

Then

The general Normal density graph is represented as:

Note that

9.02 lies 2σ below the mean.

μ2σ=9.122(0.05)=9.02

According to 689599.7 rule:

95% of the data values are within 2 standard deviations of the mean. 689599.7n.

Although,

Data values in total are 100%

Then

100%95%=5%

5% of the data values are greater than 2 standard deviations off the mean.

We also know that

The normal distribution is symmetric around the mean.

That implies

2.5 percent of the data points are more than 2 standard deviations above the mean.

And

2.5 percent of the data points are more than 2 standard deviations below the mean.

Therefore,

2.5% of the bags weigh less than 9.02 ounces.

04

Part (b) Step 1: Calculation

According to 689599.7 rule:

In a normal distribution, 68 percent of the data lies within 1 standard deviation of the mean.

In a normal distribution, 95% of the data lies within 2 standard deviations of the mean.

A normal distribution has 99.7% of its data inside 1 standard deviation of the mean.

Then

The general Normal density graph is represented as:

Note that

9.02 lies σ below the mean.

According to 689599.7 rule:

68% of the data values lie within σ (1 standard deviation) of the mean.

Although,

Data values in total are 100%

Then

μσ=9.120.05=9.07

According to 689599.7 rule:

68% of the data values lie within σ (1 standard deviation) of the mean.

Although,

Data values in total are 100%

Then

100%68%=32%

32% of the data values lie more than σ (1 standard deviation) from the mean.

We also know that

The normal distribution is symmetric about the mean.

That implies

16% of the data values are more than σ (1 standard deviation) above the mean.

We also know that

The normal distribution is symmetric about the mean.

That implies

16% of the data values are more than σ (1 standard deviation) above the mean.

And

16% of the data values are more than σ (1 standard deviation) below the mean.

The data value represented by the Xth percentile includes x% of the data values below it.

That implies

Bag that weighs 9.07 ounces has about 16% of the other weighs below it.

Thus,

The bag is at 16th percentile.

Unlock Step-by-Step Solutions & Ace Your Exams!

  • Full Textbook Solutions

    Get detailed explanations and key concepts

  • Unlimited Al creation

    Al flashcards, explanations, exams and more...

  • Ads-free access

    To over 500 millions flashcards

  • Money-back guarantee

    We refund you if you fail your exam.

Over 30 million students worldwide already upgrade their learning with Vaia!

One App. One Place for Learning.

All the tools & learning materials you need for study success - in one app.

Get started for free

Most popular questions from this chapter

The density of the earth In 1798, the English scientist Henry Cavendish measured the density of the earth several times by careful work with a torsion balance. The variable recorded was the density of the earth as a multiple of the density of water. A Normal probability plot of the data is shown.16 Use the graph to determine if this distribution of density measurement is approximately Normal.

Measuring bone density Individuals with low bone density (osteoporosis) have a high risk of broken bones (fractures). Physicians who are concerned about low bone density in patients can refer them for specialized testing. Currently, the most common method for testing bone density is dual-energy X-ray absorptiometry (DEXA). The bone density results for a patient who undergoes a DEXA test usually are reported in grams per square centimeter (g/cm2) and in standardized units. Judy, who is 25years old, has her bone density measured using DEXA. Her results indicate bone density in the hip of 948 g/cm2 and a standardized score of z=1.45The mean bone density in the hip is 956 g/cm2in the reference population of 25-year-old women like Judy.

a. Judy has not taken a statistics class in a few years. Explain to her in simple language what the standardized score reveals about her bone density.

b. Use the information provided to calculate the standard deviation of bone density in the reference population.

George’s average bowling score is180; he bowls in a league where the average for all bowlers is 150 and the standard deviation is 20Bill’s average bowling score is 190; he bowls in a league where the average is 160and the standard deviation is 15. Who ranks higher in his own league, George or Bill?

a. Bill, because his 190is higher than George’s 180

b. Bill, because his standardized score is higher than George’s.

c. Bill and George have the same rank in their leagues because both are 30pins above the mean.

d. George, because his standardized score is higher than Bill’s.

e. George, because the standard deviation of bowling scores is higher in his league.

Household incomes Refer to Exercise 10Here are summary statistics for the state median household incomes:

nMeanSDMinQ1MedQ3Max
5051742.448210.643664146071500095702071836

a. Find and interpret the z-score for North Carolina, with a median household income of $41,553

b. New Jersey had a standardized score of 1.82Find New Jersey’s median household income for that year.

Quick, click! An Internet reaction time test asks subjects to click their mouse button as soon as a light flashes on the screen. The light is programmed to go on at a randomly selected time after the subject clicks “Start.” The density curve models the amount of time the subject has to wait for the light to flash.

a. What height must the density curve have? Justify your answer.

b. About what percent of the time will the light flash more than 3.75 seconds after the subject clicks “Start”?

c. Calculate and interpret the 38th percentile of this distribution.

See all solutions

Recommended explanations on Math Textbooks

View all explanations

What do you think about this solution?

We value your feedback to improve our textbook solutions.

Study anywhere. Anytime. Across all devices.

Sign-up for free