AP4.36 A local investment club that meets monthly has 200 members ranging in age from 27 to 81. A cumulative relative frequency graph of age is shown. Approximately how many members of the club are more than 60 years of age?

a.20
b. 44
c.78
d. 90
e. 110

Short Answer

Expert verified

The correct answer is option (b) 44.

Step by step solution

01

Given information

To determine approximately about how many members of the club are more than 60 years of age.

02

Explanation

A cumulative frequency graph of the club's members' ages is provided in the question. Then calculate how many participants are around sixty years old.
As a result, at 60 years, draw a vertical line.
The horizontal line intersects the y-axis with a cumulative relative frequency of around 78%.
As can be seen in the graph below:

Now, because the cumulative frequency is around 78%, we know that $78 percent $ of the members are under the age of 60, and consequently, 100%-78%=22%of the members are over 60.
Given the fact that there are 200 members,
22%×200
=44
As a result,the option (b) is the correct answer.

Unlock Step-by-Step Solutions & Ace Your Exams!

  • Full Textbook Solutions

    Get detailed explanations and key concepts

  • Unlimited Al creation

    Al flashcards, explanations, exams and more...

  • Ads-free access

    To over 500 millions flashcards

  • Money-back guarantee

    We refund you if you fail your exam.

Over 30 million students worldwide already upgrade their learning with Vaia!

One App. One Place for Learning.

All the tools & learning materials you need for study success - in one app.

Get started for free

Most popular questions from this chapter

A scatterplot of yversus xshows a positive, nonlinear association. Two different transformations are attempted to try to linearize the association: using the logarithm of the y-values and using the square root of the y-values. Two least-squares regression lines are calculated, one that uses x to predict log(y) and the other that uses x to predict y. Which of the following would be the best reason to prefer the least-squares regression line that uses x to predict log(y)?

a. The value of r2is smaller.

b. The standard deviation of the residuals is smaller.

c. The slope is greater.

d. The residual plot has more random scatter.

e. The distribution of residuals is more Normal.

Boyle’s law Refers to Exercise 34. We took the logarithm (base 10) of the values for both volume and pressure. Here is some computer output from a linear regression analysis of the transformed data.


a. Based on the output, explain why it would be reasonable to use a power model to describe the relationship between pressure and volume.

b. Give the equation of the least-squares regression line. Be sure to define any variables you use.

c. Use the model from part (b) to predict the pressure in the syringe when the volume is 17cubic centimeters.

Insurance adjusters are always concerned about being overcharged for accident repairs. The adjusters suspect that Repair Shop1quotes higher estimates than Repair Shop2. To check their suspicion, the adjusters randomly select 12cars that were recently involved in an accident and then take each of the cars to both repair shops to obtain separate estimates of the cost to fix the vehicle. The estimates are given in hundreds of dollars.

Assuming that the conditions for inference are met, which of the following significance tests should be used to determine whether the adjusters’ suspicion is correct?

a. A pairedt test

b. A two-sample ttest

c. A t test to see if the slope of the population regression line is0

d. A chi-square test for homogeneity

e. A chi-square test for goodness of fit

Recycle and Review Exercises 29-31 refer to the following setting. Does the color in which words are printed affect your ability to read them? Do the words themselves affect your ability to name the color in which they are printed? Mr. Starnes designed a study to investigate these questions using the 16 students in his AP Statistics class as subjects. Each student performed the following two tasks in random order while a partner timed his or her performance: (1) Read 32words aloud as quickly as possible, and (2) say the color in which each of32 words is printed as quickly as possible. Try both tasks for yourself using the word list given.
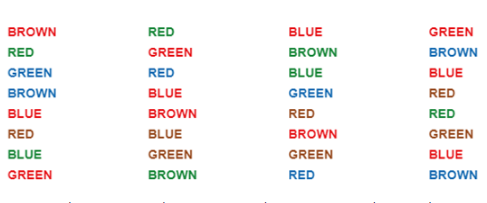
Color words (4.2) Let's review the design of the study-

a. Explain why this was an experiment and not an observational study.

b. Did Mr. Stames use a completely randomized design a: randomizéd black design? Why do you think he choose this experimental design?

c. Explain the purpose of the ramdom assignment in the context of the study.

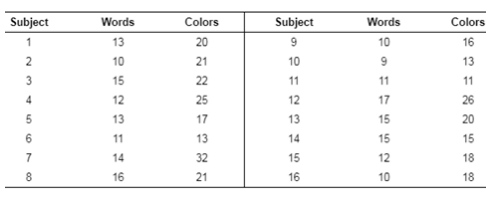
Here are the data from Mr. Stames's experiment. For each subject, the time to perform the Iwo tasks is given to the nearest second.
A distribution that represents the number of cars X parked in a randomly selected residential driveway on any night is given by

Given that there is at least 1 car parked on a randomly selected residential driveway on a particular night, which of the following is closest to the probability that exactly 4cars are parked on that driveway?

a. 0.10

b. 0.15

c. 0.17

d.0.75

e.0.90

See all solutions

Recommended explanations on Math Textbooks

View all explanations

What do you think about this solution?

We value your feedback to improve our textbook solutions.

Study anywhere. Anytime. Across all devices.

Sign-up for free