Chapter 6: Q 35. (page 373)
Exercises 35 and 36 refer to the following setting. Many chess masters and chess advocates
believe that chess play develops general intelligence, analytical skill, and the ability to
concentrate. According to such beliefs, improved reading skills should result from study to
improve chess-playing skills. To investigate this belief, researchers conducted a study. All the
subjects in the study participated in a comprehensive chess program, and their reading
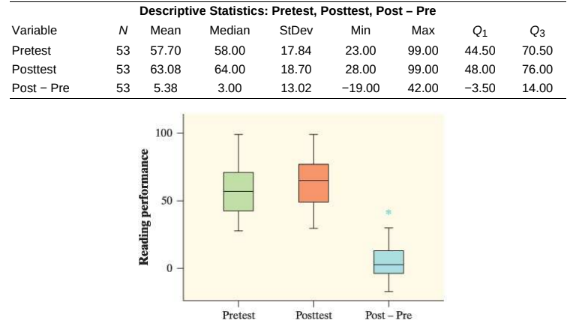
performances were measured before and after the program. The graphs and numerical
summaries that follow provide information on the subjects’ pretest scores, posttest scores, and
the difference (Post − Pre) between these two scores.
Better readers?(1.3, 4.3)
a. Did students tend to have higher reading scores after participating in the chess
program? Justify your answer.
b. If the study found a statistically significant improvement in the average reading score,
could you conclude that playing chess causes an increase in reading skills? Justify your
answer.
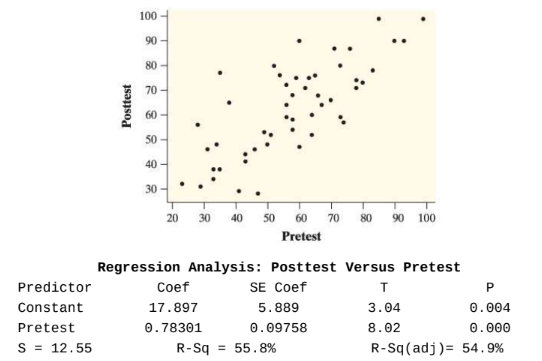
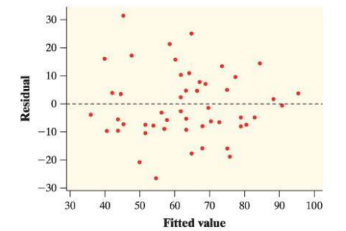
Some graphical and numerical information about the relationship between pretest and posttest scores is provided here.
a) Yes, students tend to have higher reading scores after participating in the chess
program.
b) No, playing chess could not causes an increase in reading skills.
Step by step solution
01
Step 1. Given information
We have given data by chess masters and chess advocates believe that chess play develops general intelligence, analytical skill, and the ability to concentrate.
02
a) Step 1. To find the higher reading scores after participating in the chess program.
Student tend to have higher reading scores after participating in the chess program, because the boxplot of Posttest lies slightly higher than the boxplot of Pretest and most of the boxplot of "Post-Pre" lies above 0.
Moreover, in the descriptive statistics, we note that all descriptive statistics of Posttest are greater than the corresponding descriptive statistics of Pretest (except for the maximum) and all descriptive statistics of Post-Pre are positive except for the minimum and first quartile. This confirms our conclusion.
03
b) Step 1. To find increase rate in reading skills
In the previous exercise, we concluded that students tended to have higher reading scores after participating in the chess program However, association does not necessarily mean causation, because the study did not include a control group. This then implies that the statistically significant improvement could be due to some other lurking variable (such as experience or age) instead of the treatment
Unlock Step-by-Step Solutions & Ace Your Exams!
-
Full Textbook Solutions
Get detailed explanations and key concepts
-
Unlimited Al creation
Al flashcards, explanations, exams and more...
-
Ads-free access
To over 500 millions flashcards
-
Money-back guarantee
We refund you if you fail your exam.
Over 30 million students worldwide already upgrade their
learning with Vaia!


