Exercises 35 and 36 refer to the following setting. Many chess masters and chess advocates

believe that chess play develops general intelligence, analytical skill, and the ability to

concentrate. According to such beliefs, improved reading skills should result from study to

improve chess-playing skills. To investigate this belief, researchers conducted a study. All the

subjects in the study participated in a comprehensive chess program, and their reading

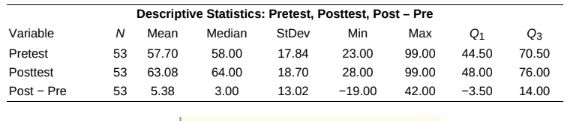
performances were measured before and after the program. The graphs and numerical

summaries that follow provide information on the subjects’ pretest scores, posttest scores, and

the difference (Post − Pre) between these two scores.

Predicting posttest scores (3.2)

a. What is the equation of the least-squares regression line relating posttest and pretest

scores? Define any variables used.

b. Is a linear model appropriate for describing this relationship? Justify your answer.

c. If we use the least-squares regression line to predict students’ posttest scores from their

pretest scores, how far off will our predictions typically be?

Short Answer

Expert verified

a) y=17.897+0.78301xwhere x represents the pretest score and y represents the posttest score.

b) Yes, a linear model appropriate for describing this relationship.

c) The predicted posttest score deviates on average by12.55 points from the actual posttest score.

Step by step solution

01

Step 1. Given information  

We have given data.

02

a) Step 1. To find the equation of the least-squares regression line.

General equation of the least squares regression line is

y=b0+b1x

Eliminate,role="math" localid="1654232338347" b0=17.897andb1=0.78301

Thus,

y=17.897+0.78301x
03

b) Step 1  Justify a linear model is appropriate for describing this relationship.

A linear model is appropriate for describing the relationship in this case, because there is no strong curvature present in the scatterplot and there is no strong curvature present in the residual plot. Moreover, the points in the residual plot appear to be randomly scattered and there appear to be no strong outliers (points that deviate strongly from the pattern in the other points), thus the model does indeed appear to be appropriate.

04

c) Step 1. To find how far off posttest scores from their pretest scores,

The standard error of the estimate s is given after"S="in the computer output:S=12.55

The standard error of the estimate s represents the average error of predictions, thus the average deviation between actual y-values and the predicted y-values.

Unlock Step-by-Step Solutions & Ace Your Exams!

  • Full Textbook Solutions

    Get detailed explanations and key concepts

  • Unlimited Al creation

    Al flashcards, explanations, exams and more...

  • Ads-free access

    To over 500 millions flashcards

  • Money-back guarantee

    We refund you if you fail your exam.

Over 30 million students worldwide already upgrade their learning with Vaia!

One App. One Place for Learning.

All the tools & learning materials you need for study success - in one app.

Get started for free

Most popular questions from this chapter

Ladies Home Journal magazine reported that 66% of all dog owners greet their dog before greeting their spouse or children when they return home at the end of the workday. Assume that this claim is true. Suppose 12 dog owners are selected at random. Let X= the number of owners who greet their dogs first.

a. Explain why it is reasonable to use the binomial distribution for probability calculations involving X.

b. Find the probability that exactly 6 owners in the sample greet their dogs first when returning home from work.

c. In fact, only 4 of the owners in the sample greeted their dogs first. Does this give convincing evidence against the Ladies Home Journal claim? Calculate P(X4) and use the result to support your answer.

Spoofing (4.2) To collect information such as passwords, online criminals use "spoofing" to direct Internet users to fraudulent websites. In one study of Internet fraud, students were warned about spoofing and then asked to log into their university account starting from the university's home page. In some cases, the log-in link led to the genuine dialog box. In others, the box looked genuine but, in fact, was linked to a different site that recorded the ID and password the student entered. The box that appeared for each student was determined at random. An alert student could detect the fraud by looking at the true Internet address displayed in the browser status bar, but most just entered their ID and password.

a. Is this an observational study or an experiment? Justify your answer.

b. What are the explanatory and response variables? Identify each variable as categorical or quantitative.

Baby elk Refer to Exercise 77 . How surprising would it be for more than 4 elk in the sample to survive to adulthood? Calculate an appropriate probability to support your answer.

The time X it takes Hattan to drive to work on a randomly selected day follows a distribution that is approximately Normal with mean 15 minutes and standard deviation 6.5 minutes. Once he parks his car in his reserved space, it takes 5 more minutes for him to walk to his office. Let T= the total time it takes Hattan to reach his office on a randomly selected day, so T=X+5. Describe the shape, center, and variability of the probability distribution of T.

Baby elk Biologists estimate that a randomly selected baby elk has a 44 % chance of surviving to adulthood. Assume this estimate is correct. Suppose researchers choose 7 baby elk at random to monitor. Let X= the number that survive to adulthood.

See all solutions

Recommended explanations on Math Textbooks

View all explanations

What do you think about this solution?

We value your feedback to improve our textbook solutions.

Study anywhere. Anytime. Across all devices.

Sign-up for free